Table of Contents
1.B - Fugitive Emissions from fossil fuels
During all stages of fuel production and use, from extraction of fossil fuels to their final use, fuel components can escape or be released as fugitive emissions.
While NMVOC, TSP and SOₓ are the most important emissions within the source category solid fuels, fugitive emissions of oil and natural gas include substantial amounts of NMVOC and SOₓ.
1.B - “Fugitive emission from fuels” consist of following sub-categories:
| NFR-Code | Name of category |
|---|---|
| 1.B.1 | Solid Fuels |
| 1.B.2.a | Oil |
| 1.B.2.b | Gas |
| 1.B.2.c | Venting and Flaring |
| 1.B.3 | Geothermal Energy |
Trends in emissions
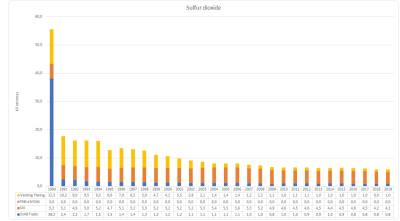
Sulphur Dioxide emissions occur during the production of hard-coal coke. The value of the year 1990 is partly based on the GDR’s emission report, chapter “Produktion” (=production) which has no clear differentiation between mining, transformation and handling of coal. The total emission as reported in the emission report is allocated in the NFR categories 1.B.1 and 2. The split factor is based on estimation of experts. The apparently steep decline from 2007 to 2008 is the result of a research project in 2010, where new emission factors were determined for coke production for the years 2008. In sub-category 1.B.2, one main driver of shrinking SO2 emission is the decreasing amount of flared natural gas. The shrinking emissions are also attributed to the declining emissions from desulphurisation, that are a result of the implementation of modern technology.
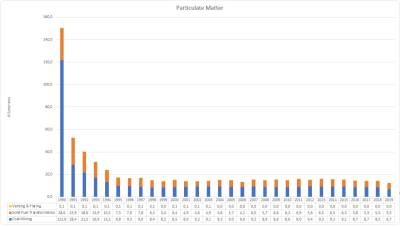
Particulate matter emissions occur during the transformation of lignite and hard coal. The very steep decline of the emissions in the early 1990s is due to the shrinking production of lignite briquettes (almost 90% in the first five years). The value of the year 1990 is partly based on the GDR’s emission report, chapter “Produktion” (=production) which has no clear differentiation between mining, transformation and handling of lignite. The total emission as reported in the emission report is allocated in the NFR categories 1.B.1 and 2. The split factor is based on estimation of experts.
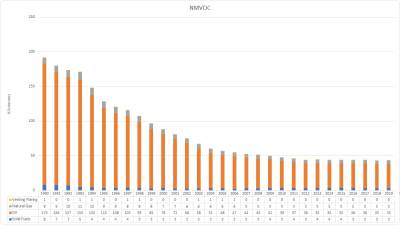
NMVOC emission occur during the production of hard-coal coke. The shrinking emissions are mainly attributed to the hard-coal coke production and the decommissioning of outdated plants. The main sources of NMVOC emissions from total petrol distribution (1.B.2.a.v) were fugitive emissions from handling and transfer (filling/unloading) and container losses (tank breathing). These emissions have decreased by round about 65 % since 1990. The decrease in fugitive emissions during this period is the result of implementation of the Technical Instructions on Air Quality Control (TA-Luft 2002) and of the 20th and 21st Ordinance on the Execution of the Federal Immission Control Act (20. and 21. BImSchV), involving introduction of vapour recovery systems. It is also the result of reduced petrol consumption. Currently, about 13 million m³ of petrol fuels are transported in Germany via railway tank cars. This transport volume entails a maximum of 300.000 handling processes (loading and unloading). Some 5.000 to 6.000 railway tank cars for transport of petrol are in service. Transfer/handling (filling/unloading) and tank losses result in emissions of only 1,4 kt VOC per year. The emissions situation points to the high technical standards that have been attained in railway tank cars and pertinent handling facilities. On the whole, oil consumption is expected to stagnate or decrease. As a result, numbers of oil storage facilities can be expected to decrease as well.
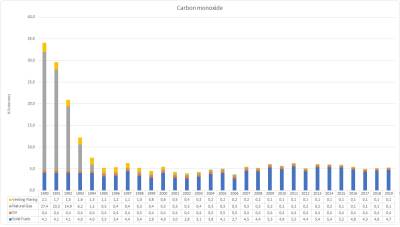
Carbon monoxide emissions occur during the production of coke and charcoal. The rising emissions are mainly attributed to the increasing production of charcoal and coke. A trend-reversing issue was the decommissioning of outdated plants in the 1990s. Flaring in oil refineries is the main source for carbon monoxide emission in category 1.B.2. In the early 1990s, emissions from distribution of town gas were also taken into account in calculations. In 1990, the town-gas distribution network accounted for a total of 16 % of the entire gas network. Of that share, 15 % consisted of grey cast iron lines and 84 % consisted of steel and ductile cast iron lines. Since 1997 no town gas has been distributed in Germany's gas mains. Town-gas was the only known source of CO emissions in category 1.B.2.b.
Recalculations
Recalculations covering the past two years have been carried out as a result of the provisional nature of a number of statistics in this area.
Furthermore, some minor changes in activity data for distribution of mineral oil products led to marginal changes in NMVOC emissions.
| NMVOC | Unit | 1990 | 1995 | 2000 | 2005 | 2010 | 2015 | 2018 |
|---|---|---|---|---|---|---|---|---|
| 2020 Submission | kt | 183,50 | 124,68 | 84,95 | 54,21 | 44,48 | 40,68 | 40,06 |
| 2021 Submission | kt | 183,47 | 124,85 | 84,91 | 54,18 | 44,35 | 40,59 | 39,93 |
| Difference | kt | 0,03 | -0,17 | 0,04 | 0,03 | 0,13 | 0,09 | 0,13 |
For pollutant-specific information on recalculated emission estimates reported for Base Year and 2015, please see the pollutant specific recalculation tables following chapter Chapter 8.1 - Recalculations].
Improvements planned for future submissions
- emissions from storage of refinery products will be divided up to fuels (under 1.B) and chemical products (2.B)
- emission factors from natural gas transmission will be updated according to results of the UNEP OGMP 2.0 measurement programm (1.B.2.b.iv)


