Table of Contents
1.A.3.b i - iv - Emissions from fuel combustion in Road Vehicles (OVERVIEW)
Short description
This overview chapter provides information on the emissions from fuel combustion activities in road transport sub-categories 1.A.3.b i, ii, iii, and iv.
| NFR-Code | Name of Category |
|---|---|
| 1.A.3.b i | Passenger Cars |
| 1.A.3.b ii | Light Duty Vehicles |
| 1.A.3.b iii | Heavy Duty Vehicles |
| 1.A.3.b iv | Mopeds & Motorcycles |
Methodology
Activity data
Basically, total inland fuel deliveries are available from the National Energy Balances (NEBs) (AGEB, 2022) 1), line 62: Straßenverkehr (Road Transport) as compiled by the Association of the German Petroleum Industry (MWV) 2).
Based upon these primary activity data, specific consumption data for the different types of road vehicles are generated within TREMOD 3).
For further details see main chapter 1.A.3.b - Road Transport as wells as the sub-category chapters linked above.
Emission factors
The majority of emissions factors for exhaust emissions from road transport are taken from the 'Handbook Emission Factors for Road Transport' (HBEFA, version 4.1) 4) where they are provided on a tier3 level mostly and processed within the TREMOD software used by the party 5).
With respect to the emission factors applied for particulate matter, given the circumstances during test-bench measurements, condensables are most likely included at least partly. 1)
As it is not possible to present these tier3 values in a comprehendible way, the NFR sub-chapters linked above provide sets of fuel-specific implied emission factors instead.
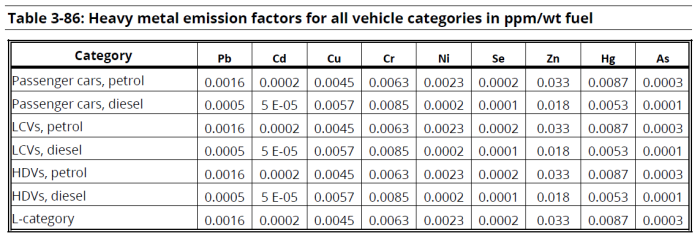
For heavy-metal (other then lead from leaded gasoline) and PAH exhaust-emissions, default emission factors from (EMEP/EEA, 2019) 6) have been applied. Regarding PCDD/F, tier1 EF from (Rentz et al., 2008) 7) are used instead.
For information on the emission factors for heavy-metal and POP exhaust emissions, please refer to Appendix 2.3 - Heavy Metal (HM) exhaust emissions from mobile sources and Appendix 2.4 - Persistent Organic Pollutant (POP) exhaust emissions from mobile sources.
Trends of exhaust emissions from road transport vehicles
For ammonia emissions, the increasing use of catalytic converters in gasoline driven cars in the 1990s lead to a steep increase whereas both the technical development of the converters and the ongoing shift from gasoline to diesel cars resulted in decreasing emissions in the following years.
The observed trends for NOx, NMVOC and CO emissions represent the changes in legislatory emission limits and the regarding implementation of mitigation technologies. The following table provides an overview of the implemetation of Euro norms in Germany.
Table 1: Overview of Euro norms adn their implementation in Germany
| Type Approval for new vehicle types | Type Approval for new vehicles | Testing Cycle | |
|---|---|---|---|
| PASSENGER CARS & LIGHT-DUYT VEHICLES: DIESEL | |||
| Euro Norm 1 | since 01. Juli 1992 | since 01. Januar 1993 | NEFZ |
| Euro 2 | since 01. Januar 1996 | since 01. Januar 1997 | NEFZ |
| Euro 3 | since 01. Januar 2000 | since 01. Januar 2001 | NEFZ |
| Euro 4 | since 01. Januar 2005 | since 01. Januar 2006 | NEFZ |
| Euro 5a8) | since 01. September 2009 | since 01. Januar 2011 | NEFZ |
| Euro 5b | since 01. September 2011 | since 01. Januar 2013 | NEFZ |
| Euro 6b9) | since 01. September 2014 | since 01. September 2015 | NEFZ |
| Euro 6c | since 01. September 2017 | since 01. September 2018 | WLTC |
| Euro 6d-Temp | since 01. September 2017 | since 01. September 2019 | WLTC |
| Euro 6d | Freiwillige Einstufung | Freiwillige Einstufung | WLTC |
| Euro 6d-ISC-FCM | since 01.01.2020 (36AP) / 10.01.2021 (36AQ-AR) | Ab 01.01.2021 (36AP) / 01.01.2022 (36AQ-AR) | WLTC |
| PASSENGER CARS & LIGHT-DUYT VEHICLES: GASOLINE | |||
| Abgasnorm Euro 1 | since 01. Juli 1992 | since 01. Januar 1993 | NEFZ |
| Euro 2 | since 01. Januar 1996 | since 01. Januar 1997 | NEFZ |
| Euro 3 | since 01. Januar 2000 | since 01. Januar 2001 | NEFZ |
| Euro 4 | since 01. Januar 2005 | since 01. Januar 2006 | NEFZ |
| Euro 5a 10) | since 01. September 2009 | since 01. Januar 2011 | NEFZ |
| Euro 6b 11) | since 01. September 2014 | since 01. September 2015 | NEFZ |
| Euro 6c | since 01. September 2017 | since 01. September 2018 | WLTC |
| Euro 6d-Temp | since 01. September 2017 | since 01. September 2019 | WLTC |
| Euro 6d | Freiwillige Einstufung | Freiwillige Einstufung | WLTC |
| Euro 6d-ISC-FCM | since 01.01.2020 (36AP) / 10.01.2021 (36AQ-AR) | Ab 01.01.2021 (36AP) / 01.01.2022 (36AQ-AR) | WLTC |
| MOPEDS | |||
| Euro 1 | since 17. Juni 1999 | ECE R47 | |
| Euro 2 | since 17. Juni 2002 | ECE R47 | |
| Euro 4 | since 01. Januar 2017 | since 01. Januar 2018 | ECE R47 |
| Euro 5 | since 01. Januar 2020 | since 01. Januar 2021 | WMTC |
| MOTORCYCLES | |||
| Euro 1 | since 17. Juni 1999 | ECE R47 | |
| Euro 2 | since 17. Juni 2002 | ECE R47 | |
| BUSES & TRUCKS | |||
| Euro I | 01. Jan 92 | ESC R-49 | |
| Euro II | 01. Okt 96 | ESC R-49 | |
| Euro III | 01. Okt 00 | ESC&ELR, ETC | |
| Euro IV | 01. Okt 05 | ESC&ELR, ETC | |
| Euro V | 01. Okt 08 | ESC&ELR, ETC | |
| Euro VI 12) | 01. Okt 13 | WHTC, WHSC | |
Trends for sulphur dioxide show charcteristics very different from those shown above. Here, the strong dependence on increasing fuel qualities leads to an cascaded downward trend of SO2 emissions, influenced only slightly by increases in fuel consumption and mileage.
The following table provides the development of sulphur contents over the years for Old (OGL) and New German Länder (NGL) and Germany (GER).
Table 2: Development of fuel sulphur contents in Germany
| Area covered | Year(s) covered | Gasoline | Diesel oil |
|---|---|---|---|
| EAST GERMANY (DDR) | until 1988 | 500 ppm | 6,000 ppm |
| 1989-1990 | 500 ppm | 6,000 ppm | |
| WEST GERMANY (BRD) | until 1984 | 250 ppm | 2,700 ppm |
| 1985 | 2,500 ppm | ||
| 1986 | 2,100 ppm | ||
| 1987 | |||
| 1988 | 1,700 ppm | ||
| 1989 | |||
| 1990 | 220 ppm | ||
| GERMANY | 1991 | 220 ppm | 1,300 ppm |
| 1992 | |||
| 1993 | |||
| 1994 | |||
| 1995 | 180 ppm | ||
| 1996 | 600 ppm | ||
| 1997 | 400 ppm | ||
| 1998-2000 | 70 ppm | 300 ppm | |
| 2001 | 55 ppm | 250 ppm | |
| 2002 | 25 ppm | 40 ppm | |
| since 2003 | 8 ppm | 8 ppm |
For exhaust particulate matter emissions from diesel road vehicles, the party assumes that nearly all particles emitted are within the PM2.5 range, resulting in similar emission values for PM2.5, PM10, and TSP. Excumptions from this assumption can be observed for gasoline road vehicles for the years until 1997 when additional TSP emissions resulted from the use of leaded gasoline that was banned in 1997. Furthermore, black carbon emissions are estimated via implied emission factors derived from fractions of PM as provided in 13).
For Heavy Metals and PAHs, emissions are calculated with tier1 default EF from 14) resulting in trends that simply reflect the annual fuel consumption.
Here, the only excumption are lead emissions from leaded gasoline that was in use until 1996 with lead contents provided in the table below:
Table 3: Development of gasoline's lead content in Germany
| Area covered | Year(s) covered | Lead content |
|---|---|---|
| EAST GERMANY (GDR) | 1989-1990 | 126 mg/l |
| WEST GERMANY (BRD) | 1990 | 42 mg/l |
| GERMANY | 1991 | 29 mg/l |
| 1992 | 20 mg/l | |
| 1993 | 16 mg/l | |
| 1994 | 11 mg/l | |
| 1995 | 8 mg/l | |
| 1996 | 4 mg/l | |
| since 1997 | 0 mg/l (banned) |
Recalculations
Recalculations of exhaust-emissions are mainly based on annual routine revisions of the underlying TREMOD model. For more information, please see the specific chapters linked above.