meta data for this page
1.A.3.b iv - Road Transport: Mopeds & Motorcycles
Short description
In sub-categories 1.A.3.b iv - Road Transport: Mopeds & Motorcycles emissions from fuel combustion in motorised two-wheelers are reported.
| Category Code | Method | AD | EF | ||||||||||||
|---|---|---|---|---|---|---|---|---|---|---|---|---|---|---|---|
| 1.A.3.b iv | T1, T3 | NS, M | CS, M, D | ||||||||||||
| NOx | NMVOC | SO2 | NH3 | PM2.5 | PM10 | TSP | BC | CO | PB | Cd | Hg | Diox | PAH | HCB | |
| Key Category: | -/- | -/- | -/- | -/- | -/- | -/- | -/- | -/- | -/- | -/- | -/- | -/- | -/- | -/- | - |
Methodology
Activity data
Specific consumption data for mopeds and motorcycles is generated within the TREMOD model (Knörr, 2022a) 1).

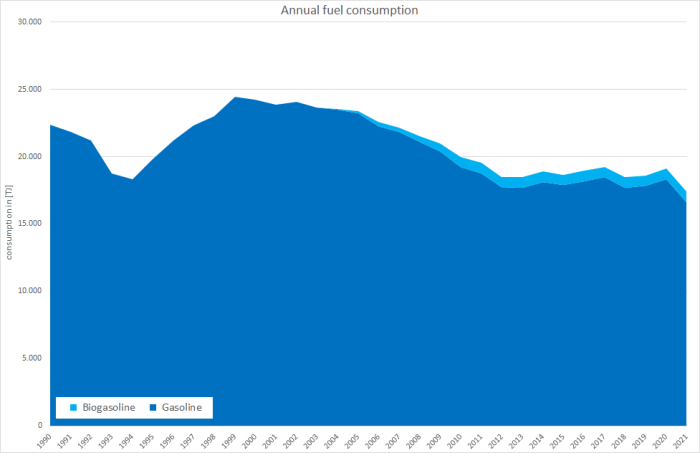
The following table provides an overview of annual amounts of gasoline fuels consumed by motorized two-wheelers in Germany.
Table 1: Annual fuel consumption of mopeds and motorcycles, in terajoules
| 1990 | 1995 | 2000 | 2005 | 2010 | 2011 | 2012 | 2013 | 2014 | 2015 | 2016 | 2017 | 2018 | 2019 | 2020 | 2021 | |
|---|---|---|---|---|---|---|---|---|---|---|---|---|---|---|---|---|
| MOPEDS | ||||||||||||||||
| Gasoline | 5.143 | 3.206 | 3.223 | 3.124 | 3.348 | 3.283 | 3.109 | 3.193 | 3.195 | 3.209 | 3.217 | 3.191 | 3.135 | 3.171 | 3.337 | 3.024 |
| Biogasoline | 0 | 0 | 0 | 21,5 | 129 | 135 | 138 | 137 | 139 | 139 | 140 | 135 | 141 | 137 | 152 | 144 |
| Ʃ Mopeds | 5.143 | 3.206 | 3.223 | 3.146 | 3.477 | 3.417 | 3.247 | 3.330 | 3.334 | 3.348 | 3.356 | 3.326 | 3.276 | 3.308 | 3.489 | 3.168 |
| MOTORCYCLES | ||||||||||||||||
| Gasoline | 17.206 | 16.634 | 20.995 | 20.078 | 15.876 | 15.485 | 14.609 | 14.511 | 14.923 | 14.686 | 14.947 | 15.280 | 14.569 | 14.676 | 14.969 | 13.600 |
| Biogasoline | 0 | 0 | 0 | 138 | 613 | 635 | 647 | 622 | 649 | 637 | 649 | 644 | 655 | 633 | 683 | 647 |
| Ʃ Motorcycles | 17.206 | 16.634 | 20.995 | 20.216 | 16.490 | 16.120 | 15.257 | 15.133 | 15.572 | 15.323 | 15.597 | 15.924 | 15.224 | 15.309 | 15.653 | 14.247 |
| MOTORIZED 2-WHEELERS: Mopeds & Motorcycles | ||||||||||||||||
| Gasoline | 22.350 | 19.840 | 24.218 | 23.202 | 19.224 | 18.768 | 17.719 | 17.705 | 18.118 | 17.895 | 18.164 | 18.471 | 17.704 | 17.847 | 18.306 | 16.625 |
| Biogasoline | 0 | 0 | 0 | 159 | 743 | 769 | 785 | 759 | 788 | 776 | 789 | 779 | 796 | 770 | 836 | 791 |
| Ʃ 1.A.3.b iv | 22.350 | 19.840 | 24.218 | 23.361 | 19.967 | 19.537 | 18.504 | 18.464 | 18.906 | 18.671 | 18.953 | 19.250 | 18.500 | 18.616 | 19.142 | 17.416 |
source: TREMOD 2)
For information on mileage, please refer to sub-chapters on emissions from tyre & brake wear and road abrasion.
Emission factors
The majority of emission factors for exhaust emissions from road transport are taken from the 'Handbook Emission Factors for Road Transport' (HBEFA, version 4.1) 3) where they are provided on a tier3 level mostly and processed within TREMOD 4).
However, it is not possible to present these highly specific tier3 values in a comprehendible way here.
With respect to the country-specific emission factors applied for particulate matter, given the circumstances during test-bench measurements, condensables are most likely included at least partly. 1)
For heavy-metal (other then lead from leaded gasoline) and PAH exhaust-emissions, default emission factors from the 2019 EMEP Guidebook (EMEP/EEA, 2019) 5) have been applied. Regarding PCDD/F, tier1 EF from (Rentz et al., 2008) 6) are used instead.
Table 2: Overview of applied EMEP/EEA defaults and other tier1 EF
| As | Cd | Cr | Cu | Hg | Ni | Pb | Se | Zn | PCDD/F | B[a]P | B[b]F | B[k]F | I[…]P | PAH 1-4 |
|---|---|---|---|---|---|---|---|---|---|---|---|---|---|---|
| [g/TJ] | [µg/km] | [mg/TJ] | ||||||||||||
| 0.007 | 0.005 | 0.145 | 0.103 | 0.200 | 0.053 | 0.037 | 0.005 | 0.758 | 0.0000027 | 192.91 | 215.88 | 156.17 | 234.25 | 799.21 |
Discussion of emission trends
NFR 1.A.3.b iv is no key category.
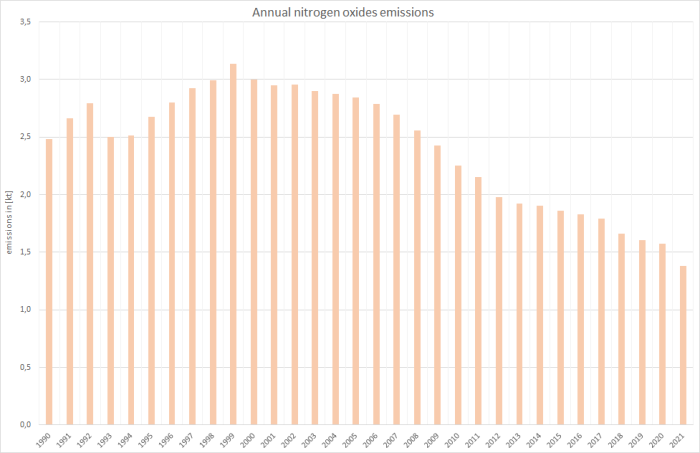
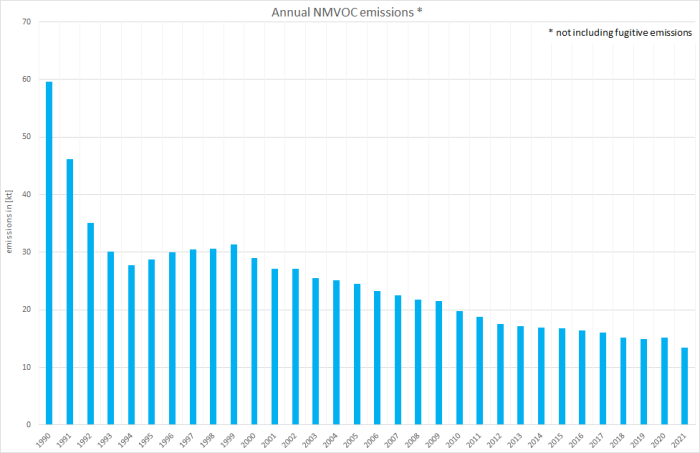
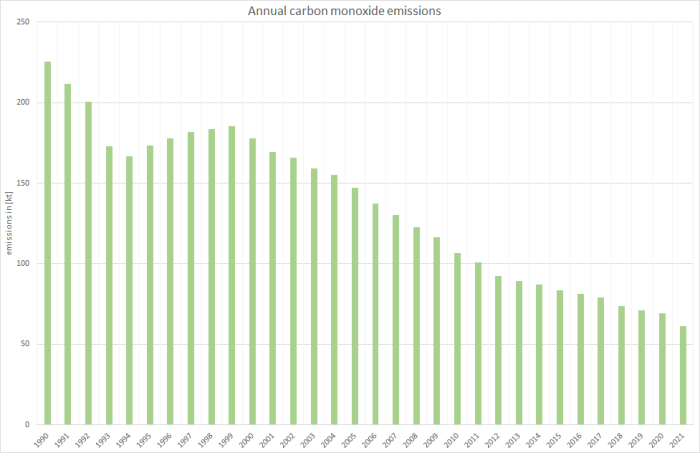
Since 1990, exhaust emissions of NOx, NMVOC, and CO have decreased due to technical improvements.
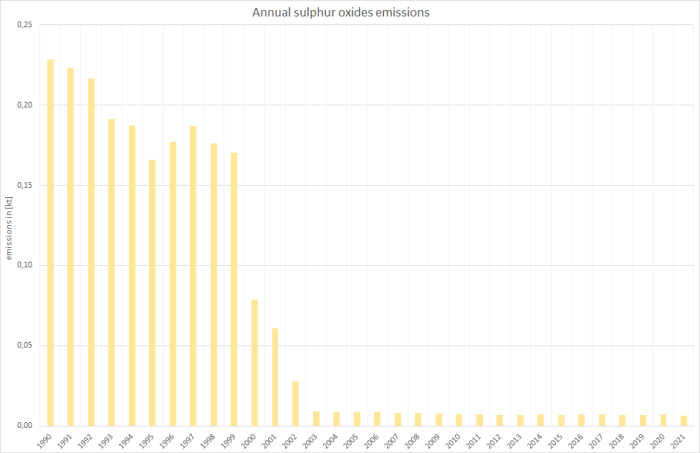
As for the entire road transport sector, the trends for sulphur dioxide exhaust emissions from two-wheelers shows charcteristics very different from those shown above: Here, the strong dependence on increasing fuel qualities (sulphur content) leads to an cascaded downward trend of emissions , influenced only slightly by increases in fuel consumption and mileage.
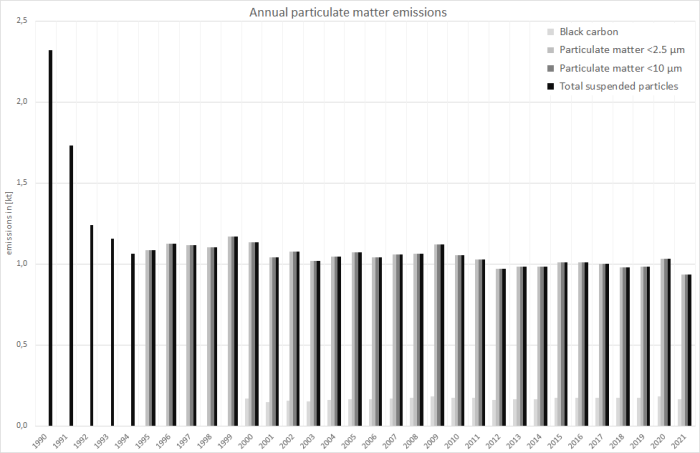
Particle emissions result from the comusbtion of gasoline and bioethanol. Here, due to the assumption that nearly all TSP emitted is formed by particles in the PM2.5 range, similar estimates are provided for all three fractions. (Exception: Until 1997, additional TSP emissions from use of leaded gasoline are included.)
Recalculations
Compared to submission 2022, recalculations were carried out due to a routine revision of the TREMOD software and the revision of several National Energy Balances (NEB).
Here, activity data were revised within TREMOD.
Table 4: Revised fuel consumption data, in terajoules
| 1990 | 1995 | 2000 | 2005 | 2010 | 2011 | 2012 | 2013 | 2014 | 2015 | 2016 | 2017 | 2018 | 2019 | 2020 | |
|---|---|---|---|---|---|---|---|---|---|---|---|---|---|---|---|
| GASOLINE | |||||||||||||||
| current submission | 22,350 | 19,840 | 24,218 | 23,202 | 19,224 | 18,768 | 17,719 | 17,705 | 18,118 | 17,895 | 18,164 | 18,471 | 17,704 | 17,847 | 18,306 |
| previous submission | 21,700 | 19,308 | 23,648 | 22,796 | 18,978 | 18,530 | 17,493 | 17,478 | 17,887 | 17,675 | 17,972 | 18,333 | 17,601 | 17,777 | 18,104 |
| absolute change | 649 | 532 | 570 | 406 | 246 | 238 | 226 | 227 | 231 | 220 | 192 | 138 | 102 | 69.3 | 202 |
| relative change | 2.99% | 2.76% | 2.41% | 1.78% | 1.30% | 1.29% | 1.29% | 1.30% | 1.29% | 1.24% | 1.07% | 0.75% | 0.58% | 0.39% | 1.11% |
| BIOGASOLINE | |||||||||||||||
| current submission | 159 | 743 | 769 | 785 | 759 | 788 | 776 | 789 | 779 | 796 | 770 | 836 | |||
| previous submission | 157 | 733 | 760 | 775 | 749 | 778 | 767 | 781 | 773 | 791 | 767 | 827 | |||
| absolute change | 2.79 | 9.51 | 9.76 | 10.02 | 9.72 | 10.1 | 9.54 | 8.33 | 5.83 | 4.59 | 2.99 | 9.20 | |||
| relative change | 1.78% | 1.30% | 1.29% | 1.29% | 1.30% | 1.29% | 1.24% | 1.07% | 0.75% | 0.58% | 0.39% | 1.11% | |||
| TOTAL FUEL CONSUMPTION | |||||||||||||||
| current submission | 22,350 | 19,840 | 24,218 | 23,361 | 19,967 | 19,537 | 18,507 | 18,468 | 18,911 | 18,676 | 18,959 | 19,257 | 18,507 | 18,625 | 19,152 |
| previous submission | 21,700 | 19,308 | 23,648 | 22,953 | 19,712 | 19,289 | 18,271 | 18,231 | 18,669 | 18,447 | 18,759 | 19,113 | 18,401 | 18,553 | 18,941 |
| absolute change | 649 | 532 | 570 | 409 | 256 | 248 | 236 | 236 | 241 | 230 | 200 | 144 | 107 | 72,3 | 211 |
| relative change | 2.99% | 2.76% | 2.41% | 1.78% | 1.30% | 1.29% | 1.29% | 1.30% | 1.29% | 1.24% | 1.07% | 0.75% | 0.58% | 0.39% | 1.11% |
Due to the variety of tier3 emission factors applied, it is not possible to display any changes in these data sets in a comprehendible way.
For pollutant-specific information on recalculated emission estimates for Base Year and 2020, please see the recalculation tables following chapter 8.1 - Recalculations.
Planned improvements
Besides a routine revision of the underlying model, no specific improvements are planned.


