meta data for this page
2.A.6 - Other Mineral Products: Ceramics
Short description
| Category Code | Method | AD | EF | ||||||||||||
|---|---|---|---|---|---|---|---|---|---|---|---|---|---|---|---|
| 2.A.6 | T1 | NS | CS | ||||||||||||
| NOx | NMVOC | SO2 | NH3 | PM2.5 | PM10 | TSP | BC | CO | Pb | Cd | Hg | Diox | PAH | HCB | |
| Key Category: | -/- | -/- | -/- | -/- | -/- | -/- | L/- | - | - | - | - | - | - | - | - |
The NFR category 2.A.6 (other) is not comparable with the CRF structure. Here you can find the same figures as CRF category 2.A.4.a Ceramics production.
The ceramics industry in Germany is very heterogeneous. It involves a large number of products that are characterized by different fields of application and corresponding chemical compositions. In addition to clay (as the main raw material), sand and other natural raw material amounts, synthetically produced materials such as aluminium oxide and silicon dioxide are also used. The mixture, which is homogenously mixed from primary raw materials and only in small quantities of secondary raw materials, is burned mainly in tunnel kilns and hearth furnaces at kiln temperatures between 1,100 - 1,300°C.
Method
In contrast to carbon dioxide, emissions of air pollutants are calculated using only the Tier 1 method, since no product-specific data are available and this source category is not a key source. In relation to the quantity produced, bricks and refractory products as well as wall and floor tiles are important.
Activity data
For submission in 2018, the production figures (activity rates) were evaluated as completely as possible by the Federal Statistical Office. In order to complete the data available, the annual production of each product category was determined in the context of an expert study in cooperation with the Federal Statistical Office (J. Gottwald et al., 2017)1). Data from the Federal Statistical Office are available in different units (tonnes, square metres, pieces, value) depending on the product. In order to ensure consistent processing of the data, it is necessary to standardize the dimensions in tonnes by using conversion factors. The conversion factors for facing bricks, backing bricks and roof tiles are calculated differently. On information provided by the Bundesverband der Deutschen Ziegelindustrie e. V. this calculation in respect of technical discussions were fundamentally revised. Up to now, for the conversion of the volume data of the official statistics for the whole time series an average value for the gross density from 1994 is used. Now new average values for the bulk density of backing bricks for the year 2016 (BV Ziegel, 2019). The bulk density has increased over time since 1994 has fallen steadily, which is due to the increase in the proportion of well-insulating lightweight bricks. The Values for raw densities for the years between 1994 and 2016 were interpolated linearly. The brick product group has by far the largest share in the ceramic Total production. A review of the methodology for the other sectors of ceramic industry was not necessary.
Emission factors
Process-related emissions originate in the raw materials for production (normally, locally available loams and clays with varying concentrations of organic impurities and specific raw material mixes). Some EF are documented in detail in a report of a research Project (Stein, Gronewäller, 2010) 2) taking into account information of industry monitoring. Other EF are based on an expert judgements from UBA due to lack in EMEP/EEA air pollutant emission inventory guidebook.
Table 1: Overview of applied emission factors, in kg/t
| EF value | EF trend | |
|---|---|---|
| NOx | 0.177 | constant |
| SO2 | 0.10 | constant |
| NMVOC | 0.008 | falling |
| NH3 | 0.004 | constant |
| TSP | 0.10 | falling |
| PM10 | 0.08 | falling |
| PM2.5 | 0.05 | falling |
Discussion of emission trends
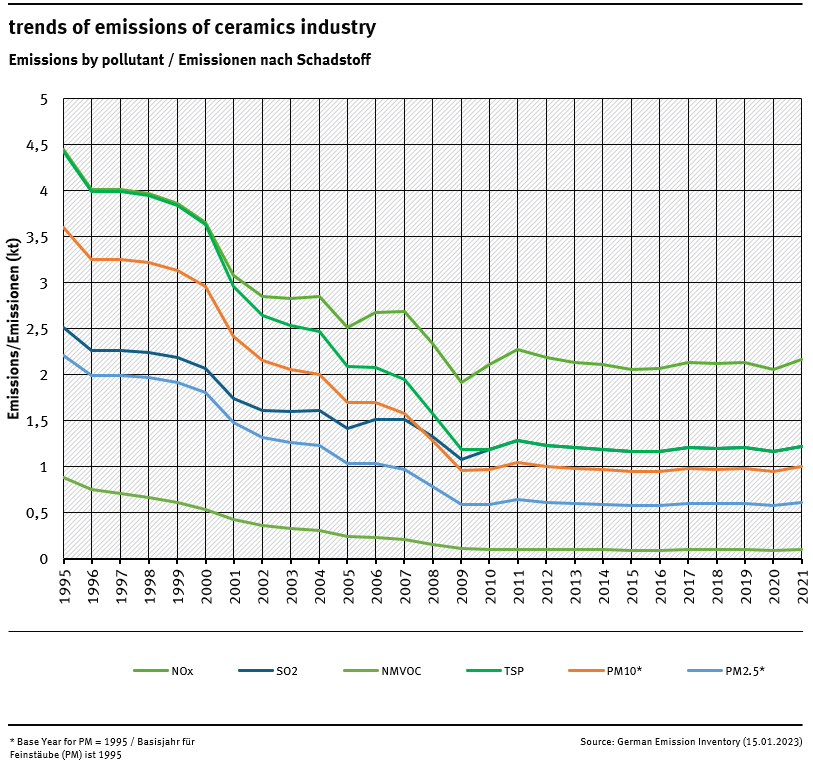
Advice for NFR-tables: The steep reduction for TSP and SO₂ from 1990 to 1991 is not result of ceramic Industry: The source for emissions data of year 1990 for eastern Germany is in cases of TSP and SO₂ the last statistic of the GDR for Mineral products and allocated at 2A6-level.
Recalculations
With activity data and emission factors remaining unrevised, no recalculations were carried out compared to Submission 2022.
Planned improvements
At the moment, no category-specific improvements are planned.


