meta data for this page
2.B.7 - Soda Ash Production
Short description
| Category Code | Method | AD | EF | ||||||||||||
|---|---|---|---|---|---|---|---|---|---|---|---|---|---|---|---|
| 2.B.7 | T1 | NS/ PS | C | ||||||||||||
| NOx | NMVOC | SO2 | NH3 | PM2.5 | PM10 | TSP | BC | CO | Pb | Cd | Hg | Diox | PAH | HCB | |
| Key Category: | - | - | - | -/- | - | - | -/- | - | - | - | - | - | - | - | - |
In Germany, soda ash is produced in three production facilities, all of which use the Solvay process. The production data is thus confidential.
Method
Activity data
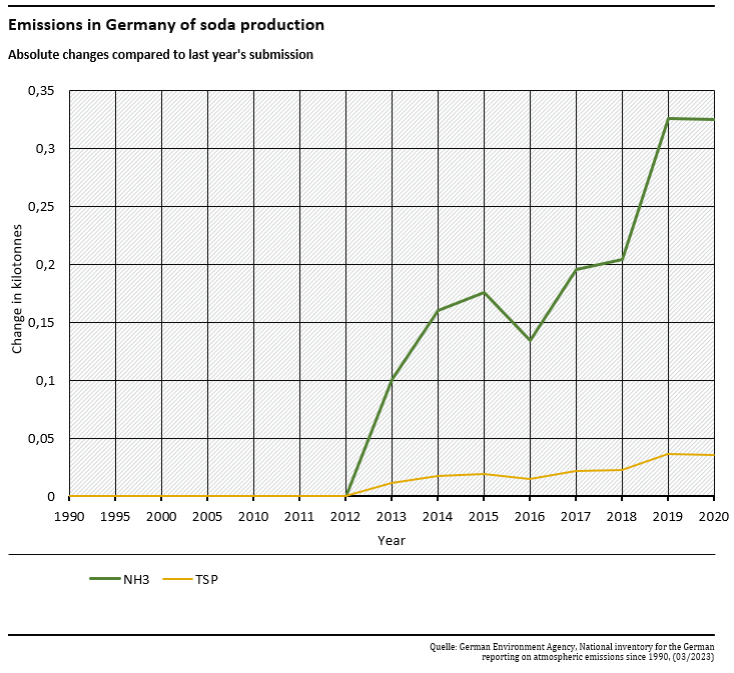
The total amounts of soda ash produced in Germany are determined with the help of two data suppliers. The Federal Statistical Office has long time series for this area. Due to the presence of a nearly inexplicable trend in the data of the Federal Statistical Office for the period since 2015, the relevant producers were contacted, and in 2021 cooperation agreements were signed with both producers (for all three production sites). The German Environment Agency (UBA), which consolidates the relevant data, has decided that as of 2013 the pertinent time series is to be filled with the producers’ data (this overlaps with a comparison carried out for the period 2013 through 2021). Since Germany has only two producers, the production-quantity data from the two sources must be kept confidential.
Emission factor
Emission factors (for TSP and NH3) are confidential due to restrictions on activity data.
Discussion of emission trends
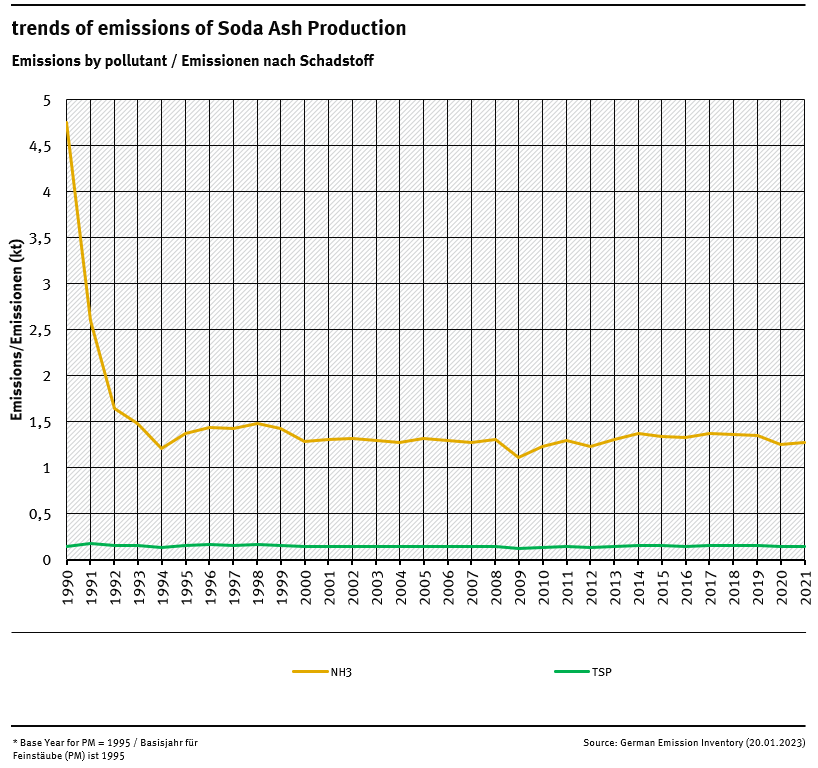
The steep reduction—especially for NH3—at the beginning of the 1990s was due to closures in the eastern German industrial sector. For the year 1990 in the case of TSP for eastern Germany, a summary figure is reported for the Chemical Industry as a whole. However, after 1992, emissions of NH3 occur at a lower level.
All trends in emissions correspond to trends of emission factors. No rising trends are to identify.
Recalculations
Recalculations were required for the time of changes in the activity data since 2013, but not for EF aspects.
For pollutant-specific information on recalculated emission estimates for Base Year and 2020, please see the pollutant specific recalculation tables following chapter 8.1 - Recalculations.
Planned improvements
No further improvements are planned at the moment.


