meta data for this page
1.A.3.b vi-vii - Road Transport: Automobile Tyre and Brake Wear and Road Abrasion
This overview chapter provides information on emissions from automobile tyre and brake wear & road abrasion are reported reported in NFR sub-categories 1.A.3.b vi and 1.A.3.b vii. These sub-categories are important sources for a) particle emissions and b) emissions of heavy metals, POPs etc. included in these particles.
| NFR-Code | Name of Category |
|---|---|
| 1.A.3.b vi | Automobile Tyre and Brake Wear |
| 1.A.3.b vii | Automobile Road Abrasion |
Methodology
Activity data
Specific mileage data for all different types of road vehicles are generated within TREMOD (Knörr et al., 2022a) 1). The following table provides an overview of annual mileages.
Table 1: Mileage data for road vehicles 1990-2020, in 106 kilometers
| 1990 | 1995 | 2000 | 2005 | 2010 | 2011 | 2012 | 2013 | 2014 | 2015 | 2016 | 2017 | 2018 | 2019 | 2020 | 2021 | |
|---|---|---|---|---|---|---|---|---|---|---|---|---|---|---|---|---|
| Passenger Cars | 492,280 | 535,524 | 565,345 | 580,076 | 596,532 | 606,233 | 607,519 | 612,573 | 623,683 | 630,995 | 638,156 | 643,711 | 643,198 | 645,829 | 548,971 | 546,127 |
| Light Duty Vehicles | 14,259 | 23,294 | 31,541 | 35,938 | 39,226 | 39,703 | 40,185 | 40,673 | 43,111 | 45,329 | 47,457 | 49,698 | 51,917 | 53,656 | 50,982 | 54,570 |
| Heavy Duty Vehicles | 40,827 | 54,025 | 62,478 | 60,919 | 61,935 | 63,562 | 63,105 | 65,194 | 65,174 | 66,412 | 68,409 | 69,216 | 70,604 | 70,007 | 67,029 | 68,726 |
| thereof: Lorries & Trucks | 36,657 | 50,109 | 58,440 | 56,788 | 57,728 | 59,339 | 58,860 | 60,896 | 60,534 | 61,548 | 63,061 | 64,704 | 66,084 | 65,435 | 64,128 | 65,876 |
| thereof: Buses | 4,170 | 3,916 | 4,038 | 4,132 | 4,208 | 4,223 | 4,245 | 4,298 | 4,640 | 4,865 | 5,349 | 4,512 | 4,520 | 4,572 | 2,901 | 2,851 |
| Two-wheelers | 15,734 | 12,303 | 15,161 | 15,621 | 15,298 | 14,866 | 14,463 | 14,196 | 14,200 | 14,508 | 14,519 | 14,503 | 14,625 | 14,842 | 14,985 | 13,407 |
| thereof: Mopeds | 5,917 | 3,830 | 4,047 | 4,191 | 4,990 | 4,855 | 4,742 | 4,755 | 4,684 | 4,870 | 4,831 | 4,730 | 4,849 | 4,922 | 5,039 | 4,479 |
| thereof: Motorcycles | 9,817 | 8,473 | 11,113 | 11,429 | 10,308 | 10,011 | 9,721 | 9,441 | 9,516 | 9,638 | 9,687 | 9,773 | 9,776 | 9,920 | 9,946 | 8,928 |
| TOTAL MILEAGE | 563,099 | 625,145 | 674,524 | 692,554 | 712,991 | 724,364 | 725,271 | 732,636 | 746,168 | 757,244 | 768,541 | 777,128 | 780,345 | 784,334 | 681,965 | 682,831 |
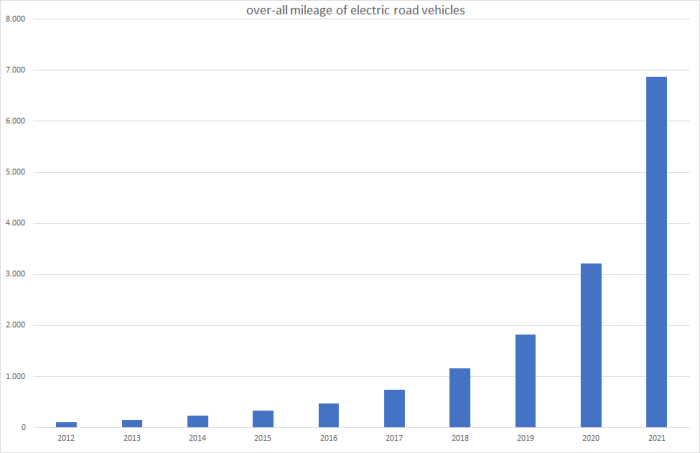
The following chart illustrates the increase in annual mileage of electric road vehicles in 106 kilometers. Despite the exponential growth, only about 1 per cent of annual mileage was “electric” in 2021 (7,000,000,000 of 682,831,000,000 km).

Discussion of emission trends
Please see sub-category chapters 1.A.3.b vi - Automobile Tyre and Brake Wear and 1.A.3.b vii - Automobile Road Abrasion .
Recalculations
Compared to last year's submission, mileage data has been revised widely due to the availability of additional data sources. However, total mileage changed only marginally.
Table 2: Revised total annual mileage data, in 106 kilometers_
| 1990 | 1995 | 2000 | 2005 | 2010 | 2011 | 2012 | 2013 | 2014 | 2015 | 2016 | 2017 | 2018 | 2019 | 2020 | |
|---|---|---|---|---|---|---|---|---|---|---|---|---|---|---|---|
| current submission | 563,099 | 625,145 | 674,524 | 692,554 | 712,991 | 724,364 | 725,271 | 732,636 | 746,168 | 757,244 | 768,541 | 777,128 | 780,345 | 784,334 | 681,965 |
| previous submission | 563,099 | 625,399 | 674,705 | 692,609 | 714,035 | 725,321 | 725,977 | 731,761 | 745,817 | 756,655 | 766,829 | 775,277 | 777,801 | 783,298 | 686,804 |
| absolute change | 0.00 | -253 | -181 | -55 | -1,044 | -957 | -705 | 875 | 351 | 589 | 1,712 | 1,851 | 2,544 | 1,036 | -4,839 |
| relative change | 0.00% | -0.04% | -0.03% | -0.01% | -0.15% | -0.13% | -0.10% | 0.12% | 0.05% | 0.08% | 0.22% | 0.24% | 0.33% | 0.13% | -0.70% |

