meta data for this page
1.A.3.b vi - Road Transport: Automobile Tyre and Brake Wear
Short description
In sub-categories 1.A.3.b vi - Road transport: Automobile tyre and brake wear emissions from automobile tyre and brake wear in RT are reported. Therefore, these sub-category is an important source for a) particle emissions and b) emissions of heavy metals, POPs etc. included in these particles.
| Category Code | Method | AD | EF | ||||||||||||
|---|---|---|---|---|---|---|---|---|---|---|---|---|---|---|---|
| 1.A.3.b vi | T1, T3 | NS, M | CS | ||||||||||||
| NOx | NMVOC | SO2 | NH3 | PM2.5 | PM10 | TSP | BC | CO | Pb | Cd | Hg | Diox | PAH | HCB | |
| Key Category: | - | - | - | - | L/- | L/- | L/- | L/- | - | L/- | -/- | - | - | -/- | - |
Methodology
Activity data
Abrasive emissions from tyre and brake wear are estimated based on vehicle-type specific mileage data.
For detailed mileage data, please see superordinate chapter on abrasive emissions from road vehicles.
Emission factors
Table 1: Emission factors applied
| Tyre Wear | Brake Wear | ||||||||||||
| PCs | LDVs | HDVs | Buses | Mopeds | Motorcycles | PCs | LDVs | HDVs | Buses | Mopeds | Motorcycles | ||
| BC | [mg/km] | 1,07 | 1,69 | 4,50 | 4,50 | 0,55 | 0,55 | 0,75 | 1,17 | 3,27 | 3,27 | 0,44 | 0,44 |
|---|---|---|---|---|---|---|---|---|---|---|---|---|---|
| PM2.5 | 4,49 | 7,10 | 18,9 | 18,9 | 1,93 | 1,93 | 2,93 | 4,56 | 12,7 | 12,7 | 1,44 | 1,44 | |
| PM10 | 6,40 | 10,1 | 27,0 | 24,3 | 2,80 | 2,80 | 7,35 | 11,5 | 32,0 | 28,8 | 3,63 | 3,63 | |
| TSP | 10,7 | 16,9 | 45,0 | 45,0 | 4,60 | 4,60 | 7,50 | 11,7 | 32,7 | 32,7 | 3,70 | 3,7 | |
| Pb | [µg/km] | 1,88 | 2,97 | 4,26 | 3,10 | 0,81 | 0,81 | 45,5 | 71,0 | 199 | 199 | 22,5 | 22,5 |
| Hg | 0 | 0 | 0 | 0 | 0 | 0 | 0 | 0 | 0 | 0 | 0 | 0 | |
| Cd | 0,05 | 0,08 | 0,11 | 0,08 | 0,02 | 0,02 | 0,17 | 0,26 | 0,73 | 0,73 | 0,08 | 0,08 | |
| As | 0,04 | 0,06 | 0,09 | 0,07 | 0,02 | 0,02 | 0,51 | 0,79 | 2,21 | 2,21 | 0,25 | 0,25 | |
| Cr | 0,26 | 0,40 | 0,58 | 0,42 | 0,11 | 0,11 | 17,3 | 27,0 | 75,7 | 75,7 | 8,55 | 8,55 | |
| Cu | 1,86 | 2,94 | 4,21 | 3,06 | 0,80 | 0,80 | 383 | 598 | 1674 | 1674 | 189 | 189 | |
| Ni | 0,32 | 0,51 | 0,72 | 0,53 | 0,14 | 0,14 | 2,45 | 3,83 | 10,71 | 10,71 | 1,21 | 1,21 | |
| Se | 0,21 | 0,34 | 0,48 | 0,35 | 0,09 | 0,09 | 0,15 | 0,23 | 0,66 | 0,66 | 0,07 | 0,07 | |
| Zn | 79,5 | 126 | 180 | 131 | 34,2 | 34,2 | 65,1 | 102 | 284 | 284 | 32,1 | 32,1 | |
| B[a]P | 0,032 | 0,049 | 0,134 | 0,120 | 0,013 | 0,013 | NA | NA | NA | NA | NA | NA | |
| B[b]F | 0,038 | 0,063 | 0,161 | 0,144 | 0,019 | 0,019 | NA | NA | NA | NA | NA | NA | |
| B[k]F | 0 | 0 | 0 | 0 | 0 | 0 | NA | NA | NA | NA | NA | NA | |
| I[..]P | 0,019 | 0,028 | 0,082 | 0,072 | 0,006 | 0,006 | NA | NA | NA | NA | NA | NA | |
| ∑ PAHs 1-4 | 0,090 | 0,140 | 0,379 | 0,336 | 0,038 | 0,038 | NA | NA | NA | NA | NA | NA | |
Discussion of emission trends
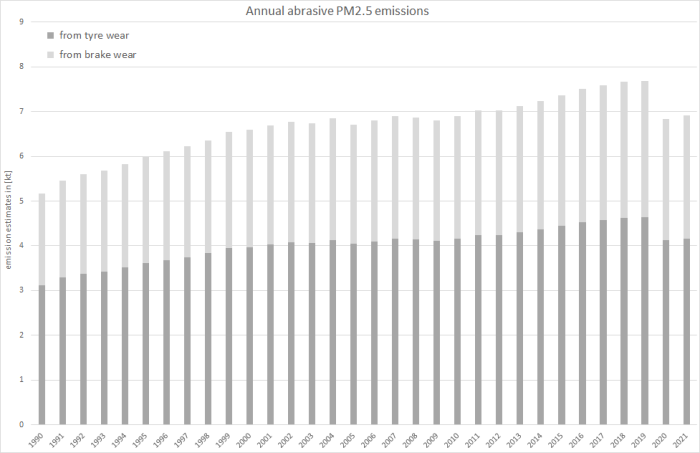
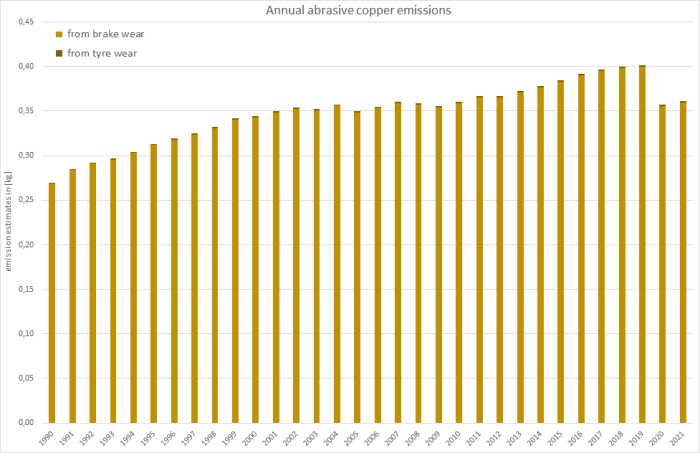
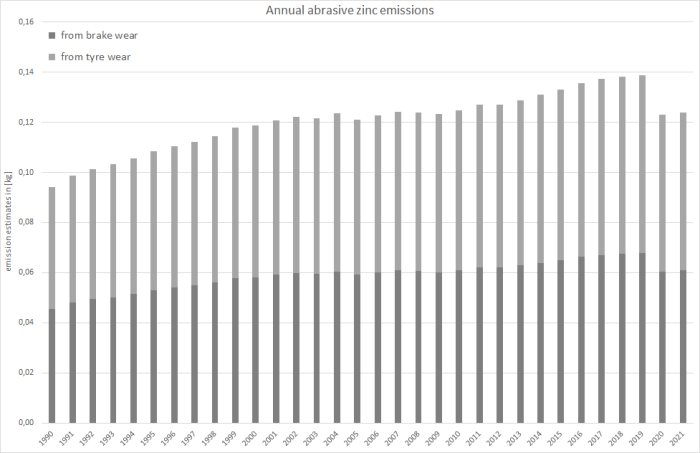
(emissions from wear/abrasion only; no fuel combustion included)
Table 2: Outcome of Key Category Analysis
| for: | BC | Pb | TSP | PM10 | PM2.5 |
|---|---|---|---|---|---|
| by: | Level | L/- | L/- | Level & Trend | L/- |
All reported emissons from tyre and brake wear are connected directly to the mileage driven by the road vehicles covered.
Whereas annual copper emissions result almost entirely from the wear of (disc) brakes…
…zinc emissions result from both tyre and brake wear with high amounts of zinc used in tyre rubber and drum brakes applied in trucks (heayv loads) and buses (stop-and-go).
Recalculations
Compared to last year's submission, emission estimates have been revised due to updated mileage data (see super-ordinate chapter). Differences in the relative changes provided for the specific pollutants result from the different emission factors applied for the different vehicle types.
Table : Revised emission estimates for particulate matter, copper and zinc, in [kt]
| 1990 | 1995 | 2000 | 2005 | 2010 | 2011 | 2012 | 2013 | 2014 | 2015 | 2016 | 2017 | 2018 | 2019 | 2020 | |
|---|---|---|---|---|---|---|---|---|---|---|---|---|---|---|---|
| Black Carbon (BC) - from tyre wear only | |||||||||||||||
| current submission | 1.27 | 1.47 | 1.62 | 1.65 | 1.69 | 1.73 | 1.72 | 1.75 | 1.78 | 1.81 | 1.84 | 1.87 | 1.88 | 1.89 | 1.68 |
| previous submission | 1.27 | 1.47 | 1.62 | 1.65 | 1.70 | 1.73 | 1.73 | 1.74 | 1.78 | 1.80 | 1.83 | 1.85 | 1.86 | 1.88 | 1.69 |
| absolute change | 0.00 | 0.00 | 0.00 | 0.00 | -0.01 | -0.01 | -0.01 | 0.01 | 0.00 | 0.00 | 0.01 | 0.01 | 0.02 | 0.01 | -0.01 |
| relative change | 0.00% | -0.13% | -0.09% | -0.03% | -0.48% | -0.43% | -0.32% | 0.39% | 0.15% | 0.25% | 0.73% | 0.78% | 1.06% | 0.43% | -0.43% |
| PM2.5 | |||||||||||||||
| current submission | 5.16 | 6.00 | 6.59 | 6.70 | 6.89 | 7.02 | 7.02 | 7.13 | 7.24 | 7.36 | 7.50 | 7.59 | 7.66 | 7.68 | 6.84 |
| previous submission | 5.16 | 6.00 | 6.60 | 6.70 | 6.93 | 7.05 | 7.04 | 7.10 | 7.23 | 7.34 | 7.45 | 7.53 | 7.58 | 7.65 | 6.87 |
| absolute change | 0.00 | -0.01 | -0.01 | 0.00 | -0.03 | -0.03 | -0.02 | 0.03 | 0.01 | 0.02 | 0.05 | 0.06 | 0.08 | 0.03 | -0.03 |
| relative change | 0.00% | -0.13% | -0.09% | -0.03% | -0.48% | -0.43% | -0.32% | 0.39% | 0.15% | 0.25% | 0.73% | 0.78% | 1.06% | 0.43% | -0.43% |
| PM10 | |||||||||||||||
| current submission | 9.56 | 11.11 | 12.21 | 12.42 | 12.78 | 13.01 | 13.01 | 13.21 | 13.41 | 13.64 | 13.90 | 14.07 | 14.20 | 14.24 | 12.68 |
| previous submission | 9.56 | 11.12 | 12.22 | 12.42 | 12.84 | 13.07 | 13.05 | 13.16 | 13.40 | 13.60 | 13.80 | 13.96 | 14.05 | 14.17 | 12.73 |
| absolute change | 0.00 | -0.01 | -0.01 | 0.00 | -0.06 | -0.06 | -0.04 | 0.05 | 0.02 | 0.03 | 0.10 | 0.11 | 0.15 | 0.06 | -0.05 |
| relative change | 0.00% | -0.13% | -0.09% | -0.03% | -0.48% | -0.43% | -0.32% | 0.39% | 0.14% | 0.24% | 0.70% | 0.79% | 1.07% | 0.43% | -0.40% |
| Total Suspended Particles (TSP) | |||||||||||||||
| current submission | 12.67 | 14.71 | 16.17 | 16.45 | 16.91 | 17.23 | 17.23 | 17.49 | 17.76 | 18.06 | 18.40 | 18.63 | 18.79 | 18.85 | 16.78 |
| previous submission | 12.67 | 14.73 | 16.18 | 16.45 | 17.00 | 17.30 | 17.28 | 17.42 | 17.74 | 18.01 | 18.27 | 18.49 | 18.60 | 18.77 | 16.85 |
| absolute change | 0.00 | -0.02 | -0.01 | 0.00 | -0.08 | -0.07 | -0.05 | 0.07 | 0.03 | 0.05 | 0.13 | 0.15 | 0.20 | 0.08 | -0.07 |
| relative change | 0.00% | -0.13% | -0.09% | -0.03% | -0.48% | -0.43% | -0.32% | 0.39% | 0.15% | 0.25% | 0.73% | 0.78% | 1.06% | 0.43% | -0.43% |
| Copper (Cu) | |||||||||||||||
| current submission | 0.27 | 0.31 | 0.34 | 0.35 | 0.36 | 0.37 | 0.37 | 0.37 | 0.38 | 0.38 | 0.39 | 0.40 | 0.40 | 0.40 | 0.36 |
| previous submission | 0.27 | 0.31 | 0.34 | 0.35 | 0.36 | 0.37 | 0.37 | 0.37 | 0.38 | 0.38 | 0.39 | 0.39 | 0.40 | 0.40 | 0.36 |
| absolute change | 0.00 | 0.00 | 0.00 | 0.00 | 0.00 | 0.00 | 0.00 | 0.00 | 0.00 | 0.00 | 0.00 | 0.00 | 0.00 | 0.00 | 0.00 |
| relative change | 0.00% | -0.14% | -0.09% | -0.03% | -0.48% | -0.44% | -0.32% | 0.40% | 0.16% | 0.26% | 0.74% | 0.80% | 1.08% | 0.44% | -0.42% |
| Zinc (Zn) | |||||||||||||||
| current submission | 0.09 | 0.11 | 0.12 | 0.12 | 0.12 | 0.13 | 0.13 | 0.13 | 0.13 | 0.13 | 0.14 | 0.14 | 0.14 | 0.14 | 0.12 |
| previous submission | 0.09 | 0.11 | 0.12 | 0.12 | 0.13 | 0.13 | 0.13 | 0.13 | 0.13 | 0.13 | 0.13 | 0.14 | 0.14 | 0.14 | 0.12 |
| absolute change | 0.00 | 0.00 | 0.00 | 0.00 | 0.00 | 0.00 | 0.00 | 0.00 | 0.00 | 0.00 | 0.00 | 0.00 | 0.00 | 0.00 | 0.00 |
| relative change | 0.00% | -0.11% | -0.07% | -0.02% | -0.39% | -0.35% | -0.26% | 0.31% | 0.11% | 0.19% | 0.56% | 0.64% | 0.86% | 0.35% | -0.49% |
For pollutant-specific information on recalculated emission estimates for Base Year and 2020, please see the recalculation tables following chapter 8.1 - Recalculations.
Planned improvements
Besides a routine revision of the underlying model, no specific improvements are planned.


