meta data for this page
1.A.3.b iii - Transport: Road Transport: Heavy Duty Vehicles and Buses
Short description
In sub-category 1.A.3.b iii - Road Transport: Heavy Duty Vehicles and Buses emissions from fuel combustion in trucks, lorries, buses etc. are reported.
| Category Code | Method | AD | EF | ||||||||||||
|---|---|---|---|---|---|---|---|---|---|---|---|---|---|---|---|
| 1.A.3.b iii | T1, T3 | NS, M | CS, M, D | ||||||||||||
| NOx | NMVOC | SO2 | NH3 | PM2.5 | PM10 | TSP | BC | CO | PB | Cd | Hg | Diox | PAH | HCB | |
| Key Category: | L/T | -/- | -/- | -/- | L/T | L/T | -/- | L/T | -/- | -/- | -/- | -/- | -/- | -/- | - |
Methodology
Activity data

Specific consumption data for heavy-duty vehicles (trucks and lorries) and buses are generated within TREMOD 1). - The following tables provide an overview of annual amounts of fuels consumed by these vehicles in Germany.
Table 1: Annual fuel consumption of trucks and lorries, in terajoules
| 1990 | 1995 | 2000 | 2005 | 2010 | 2011 | 2012 | 2013 | 2014 | 2015 | 2016 | 2017 | 2018 | 2019 | 2020 | 2021 | |
|---|---|---|---|---|---|---|---|---|---|---|---|---|---|---|---|---|
| thereof: Buses | ||||||||||||||||
| Diesel oil | 54,449 | 46,071 | 46,040 | 37,582 | 43,949 | 43,549 | 46,516 | 47,685 | 44,800 | 47,766 | 49,068 | 47,777 | 45,841 | 47,939 | 31,448 | 29,736 |
| Biodiesel | 72 | 510 | 2,511 | 3,369 | 3,039 | 3,283 | 2,828 | 2,753 | 2,613 | 2,601 | 2,551 | 2,665 | 2,730 | 2,612 | 2,066 | |
| CNG | 1,147 | 2,141 | 1,962 | 2,152 | 1,737 | 1,667 | 1,576 | 1,213 | 1,155 | 956 | 1,004 | 983 | 983 | |||
| Biogas | 307 | 344 | 420 | 266 | 285 | 319 | 257 | 408 | 529 | 470 | ||||||
| Petroleum | 610 | 414 | ||||||||||||||
| Ʃ Buses | 54,449 | 46,143 | 46,550 | 41,240 | 49,459 | 48,550 | 52,258 | 52,594 | 49,640 | 52,221 | 53,167 | 51,802 | 49,720 | 52,082 | 35,572 | 33,255 |
| thereof: Trucks & Lorries | ||||||||||||||||
| Diesel oil | 382,330 | 507,334 | 590,322 | 455,044 | 509,974 | 510,920 | 535,523 | 550,889 | 523,710 | 543,429 | 549,899 | 555,099 | 542,086 | 552,663 | 535,871 | 523,678 |
| Biodiesel | 792 | 6,540 | 30,409 | 39,098 | 35,648 | 37,795 | 32,670 | 32,182 | 29,726 | 29,153 | 29,634 | 31,511 | 31,478 | 44,513 | 36,381 | |
| CNG | 393 | 336 | 320 | 272 | 190 | 182 | 164 | 206 | 276 | 444 | ||||||
| Biogas | 56,2 | 66,6 | 80,5 | 45,8 | 44,7 | 50 | 44 | 84 | 148 | 212 | ||||||
| LNG | 36,1 | 41,1 | 46,7 | 52,2 | 63,0 | 104 | 192 | 830 | 2.511 | 5.045 | ||||||
| Ʃ Trucks & Lorries | 382,330 | 508,125 | 596,862 | 485,453 | 549,072 | 546,569 | 573,767 | 583,962 | 556,292 | 573,472 | 579,287 | 584,964 | 573,805 | 584,432 | 580,807 | 560,715 |
| HDVs over-all | ||||||||||||||||
| Diesel oil | 436,779 | 553,405 | 636,362 | 492,626 | 553,922 | 554,469 | 582,039 | 598,574 | 568,510 | 591,195 | 598,967 | 602,876 | 587,927 | 600,602 | 567,318 | 553,414 |
| Biodiesel | 863 | 7,050 | 32,920 | 42,467 | 38,687 | 41,078 | 35,498 | 34,935 | 32,339 | 31,754 | 32,184 | 34,175 | 34,209 | 47,125 | 38,446 | |
| CNG | 1,147 | 2,141 | 1,962 | 2,545 | 2,074 | 1,986 | 1,848 | 1,403 | 1,337 | 1,120 | 1,211 | 1,259 | 1,428 | |||
| Biogas | 364 | 410 | 501 | 312 | 330 | 369 | 301 | 492 | 677 | 682 | ||||||
| Petroleum | 610 | 414 | ||||||||||||||
| LNG | 36,1 | 41,1 | 46,7 | 52,2 | 63,0 | 104 | 192 | 830 | 2.511 | 5.045 | ||||||
| Ʃ 1.A.3.b iii | 436,779 | 554,878 | 643,825 | 526,693 | 598,531 | 595,118 | 626,061 | 636,598 | 605,979 | 625,745 | 632,517 | 636,870 | 623,716 | 637,344 | 618,890 | 599,016 |
source: TREMOD 2)
For information on mileage, please refer to sub-chapters on emissions from tyre & brake wear and road abrasion.
Emission factors
The majority of emission factors for exhaust emissions from road transport are taken from the 'Handbook Emission Factors for Road Transport' (HBEFA, version 4.1) 3) where they are provided on a tier3 level mostly and processed within the TREMOD software used by the party 4).
However, it is not possible to present these tier3 values in a comprehendible way here.
With respect to the country-specific emission factors applied for particulate matter, given the circumstances during test-bench measurements, condensables are most likely included at least partly. 1)
For heavy-metal (other then lead from leaded gasoline) and PAH exhaust-emissions, default emission factors from the 2019 EMEP Guidebook (EMEP/EEA, 2019) 5) have been applied. Regarding PCDD/F, tier1 EF from (Rentz et al., 2008) 6) are used instead.
Table 2: tier1 EF derived from default values
| Pb | Cd | Hg | As | Cr | Cu | Ni | Se | Zn | B[a]P | B[b]F | B[k]F | I[…]P | PAH 1-4 | PCDD/F | |
| [g/TJ] | [mg/TJ] | [µg/km] | |||||||||||||
| Diesel oil | 0.012 | 0.001 | 0.123 | 0.002 | 0.198 | 0.133 | 0.005 | 0.002 | 0.419 | 498 | 521 | 275 | 493 | 1,788 | |
|---|---|---|---|---|---|---|---|---|---|---|---|---|---|---|---|
| Biodiesel | 0.013 | 0.001 | 0.142 | 0.003 | 0.228 | 0.153 | 0.005 | 0.003 | 0.483 | 575 | 601 | 317 | 569 | 2,062 | |
| CNG & Biogas | NE | NE | NE | NE | NE | NE | NE | NE | NE | NE | NE | NE | NE | NE | |
| Petroleum | NE | NE | NE | NE | NE | NE | NE | NE | NE | NE | NE | NE | NE | NE | |
| all fuels: buses | 0.000019 | ||||||||||||||
| all fuels: trucks & lorries | 0.000016 | ||||||||||||||

Discussion of emission trends
Table 3: Outcome of Key Category Analysis
| for: | NOx | BC | PM10 | PM2.5 |
|---|---|---|---|---|
| by: | L/T | L/T | L/T | L/T |
Nitrogen oxides
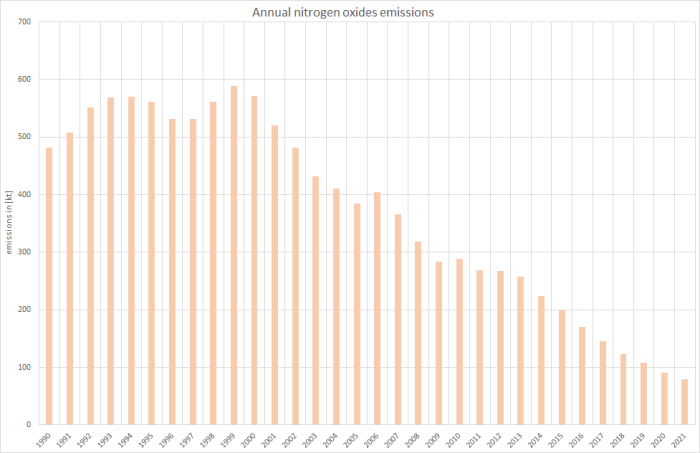
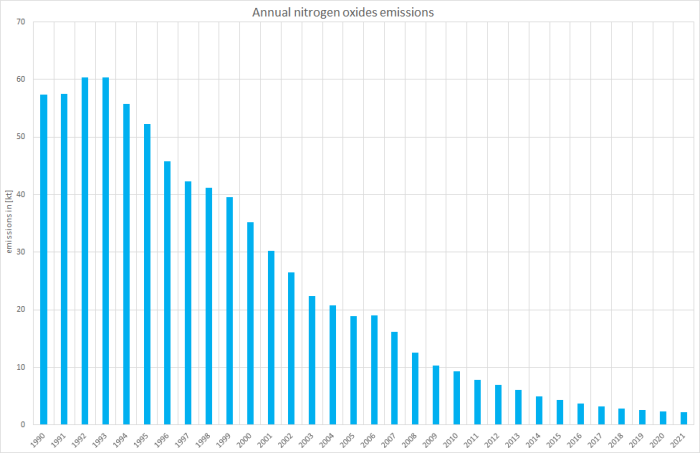
Until 2005, NOx emissions followed mileage and fuel consumption. Since 2006, in contrast to nearly unchanged fuel consumption, emissions have decreased due to controlled catalytic-converter use and engine improvements resulting from continual tightening of emissions laws.
Table 4: EURO norms and their effect on limit values of NOx emissions from diesel heavy-duty vehicles, in [g/kWh]
| pre-Euro | Euro I | Euro II | Euro III | Euro IV | Euro V | Euro VI7) |
|---|---|---|---|---|---|---|
| 14,4 | 8/9 | 7 | 5 | 3,5 | 2 | 0,4 / 0,46 |
Non-methane volatile organic compounds (NMVOC) and carbon monoxide
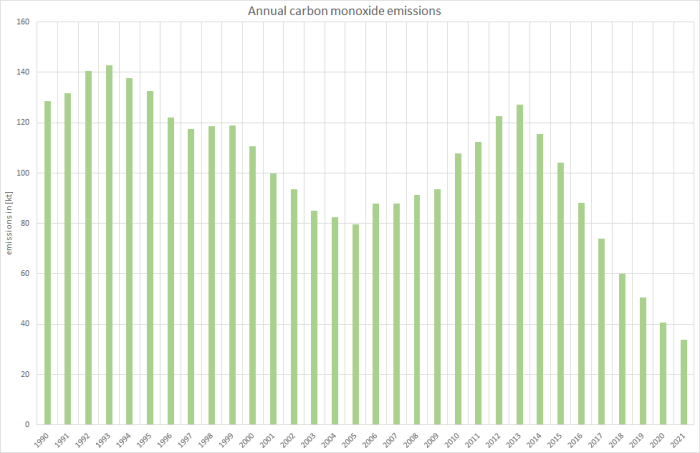
Since 1990, exhaust emissions of NMVOC and carbon monoxide have decreased sharply due to catalytic-converter use and engine improvements resulting from ongoing tightening of emissions laws and improved fuel quality.
Table 4: EURO norms and their effect on limit values of CO emissions from diesel heavy-duty vehicles, in [g/kWh]
| pre-Euro | Euro I | Euro II | Euro III | Euro IV | Euro V | Euro VI8) |
|---|---|---|---|---|---|---|
| 11,2 | 4,5 / 4,9 | 4 | 2,1 | 1,5 | 1,5 | 1,5 |
Ammonia and sulphur dioxide
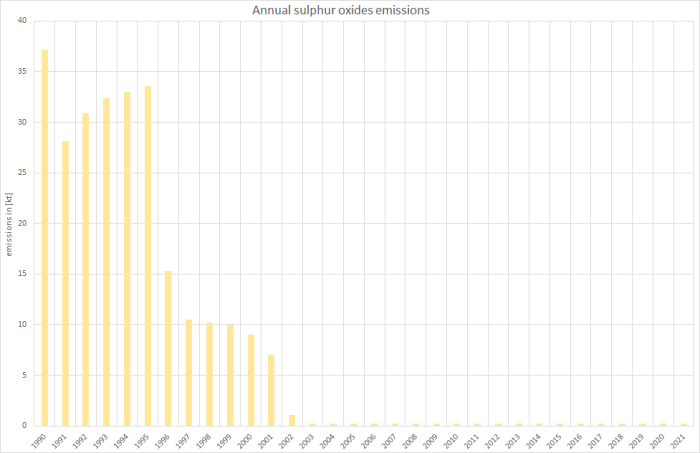
As for the entire road transport sector, the trends for sulphur dioxide (SO2) and ammonia (NH3) exhaust emissions from heavy duty vehicles show charcteristics different from those shown above: Here, the strong dependence on increasing fuel qualities (sulphur content) leads to an cascaded downward trend of SO2 emissions , influenced only slightly by increases in fuel consumption and mileage. For ammonia emissions the increasing use of catalytic converters in gasoline driven cars in the 1990s lead to a steep increase whereas both the technical development of the converters and the ongoing shift from gasoline to diesel cars resulted in decreasing emissions in the following years.
Particulate matter & Black carbon
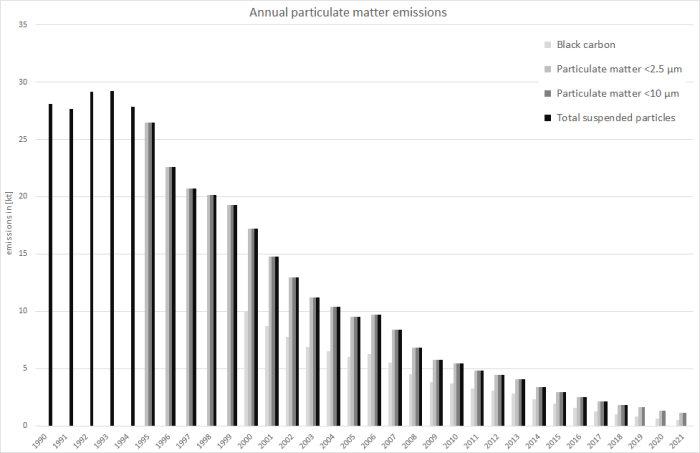
As for all reported exhaust PM emissions from mobile diesel vehicles the Party assumes that nearly all particles emitted are within the PM2.5 range, resulting in similar emission values for PM2.5, PM10, and TSP.
Recalculations
Compared to submission 2022, recalculations were carried out due to a routine revision of the TREMOD software and the revision of several National Energy Balances (NEB).
Here, activity data were revised within TREMOD due to the provision of the final NEB 2020.
Furthermore, significant re-allocations of consumption shares between the different vehicle types and classes were conducted, effecting the entire time series but with the 1.A.3.b consumptipon totals remaining unaltered. Here, diesel fuels have been re-allocated to passenger cars (see 1.A.3.b i) and light duty vehicles (see 1.A.3.b ii).
Table 4: Revised fuel consumption data, in terajoules
| 1990 | 1995 | 2000 | 2005 | 2010 | 2011 | 2012 | 2013 | 2014 | 2015 | 2016 | 2017 | 2018 | 2019 | 2020 | |
|---|---|---|---|---|---|---|---|---|---|---|---|---|---|---|---|
| DIESEL OIL | |||||||||||||||
| current Submission | 436,779 | 553,405 | 636,362 | 492,626 | 553,922 | 554,469 | 582,039 | 598,574 | 568,510 | 591,195 | 598,967 | 602,876 | 587,927 | 600,602 | 567,318 |
| previous Submission | 459,124 | 590,259 | 680,299 | 526,071 | 571,016 | 571,405 | 598,290 | 615,392 | 585,865 | 608,497 | 615,976 | 619,134 | 602,053 | 612,992 | 576,728 |
| absolute change | -22,345 | -36,854 | -43,937 | -33,445 | -17,093 | -16,936 | -16,252 | -16,818 | -17,354 | -17,302 | -17,009 | -16,259 | -14,125 | -12,390 | -9,410 |
| relative change | -4.87% | -6.24% | -6.46% | -6.36% | -2.99% | -2.96% | -2.72% | -2.73% | -2.96% | -2.84% | -2.76% | -2.63% | -2.35% | -2.02% | -1.63% |
| BIODIESEL | |||||||||||||||
| current Submission | 863 | 7,050 | 32,920 | 42,467 | 38,687 | 41,078 | 35,498 | 34,935 | 32,339 | 31,754 | 32,184 | 34,175 | 34,209 | 47,125 | |
| previous Submission | 921 | 7,537 | 35,155 | 43,778 | 39,869 | 42,225 | 36,496 | 36,002 | 33,285 | 32,656 | 33,052 | 34,996 | 34,915 | 47,907 | |
| absolute change | -57 | -487 | -2,235 | -1,310 | -1,182 | -1,147 | -997 | -1,066 | -946 | -902 | -868 | -821 | -706 | -782 | |
| relative change | -6.24% | -6.46% | -6.36% | -2.99% | -2.96% | -2.72% | -2.73% | -2.96% | -2.84% | -2.76% | -2.63% | -2.35% | -2.02% | -1.63% | |
| CNG | |||||||||||||||
| current Submission | 1,147 | 2,141 | 1,962 | 2,545 | 2,074 | 1,986 | 1,848 | 1,403 | 1,337 | 1,120 | 1,211 | 1,259 | |||
| previous Submission | 1,183 | 2,200 | 2,011 | 2,552 | 2,058 | 1,979 | 1,866 | 1,407 | 1,337 | 1,125 | 1,226 | 1,500 | |||
| absolute change | -35.5 | -59.3 | -48.7 | -6.71 | 15.64 | 7.04 | -18.68 | -4.15 | -0.65 | -5.15 | -15.3 | -242 | |||
| relative change | -3.00% | -2.69% | -2.42% | -0.26% | 0.76% | 0.36% | -1.00% | -0.30% | -0.05% | -0.46% | -1.24% | -16.1% | |||
| BIOGAS | |||||||||||||||
| current Submission | 364 | 410 | 501 | 312 | 330 | 369 | 301 | 492 | 677 | ||||||
| previous Submission | 365 | 407 | 499 | 315 | 331 | 370 | 303 | 498 | 688 | ||||||
| absolute change | -0.96 | 3.09 | 1.77 | -3.15 | -0.98 | -0.18 | -1.39 | -6.20 | -11.2 | ||||||
| relative change | -0.26% | 0.76% | 0.36% | -1.00% | -0.30% | -0.05% | -0.46% | -1.24% | -1.62% | ||||||
| LNG | |||||||||||||||
| current Submission | 36 | 41 | 47 | 52 | 63,0 | 104 | 192 | 830 | 2.511 | ||||||
| previous Submission | 37 | 42 | 47 | 50 | 57,9 | 91 | 163 | 697 | 2.108 | ||||||
| absolute change | -0.52 | -0.49 | 0.04 | 2.20 | 5.16 | 12.5 | 29.1 | 134 | 402 | ||||||
| relative change | -1.41% | -1.17% | 0.09% | 4.39% | 8.92% | 13.7% | 17.9% | 19.2% | 19.1% | ||||||
| PETROLEUM | |||||||||||||||
| current Submission | 610 | 414 | |||||||||||||
| previous Submission | 610 | 414 | |||||||||||||
| absolute change | 0,00 | 0,00 | |||||||||||||
| relative change | 0,00% | 0,00% | |||||||||||||
| TOTAL FUEL CONSUMPTION | |||||||||||||||
| current Submission | 436,779 | 554,878 | 643,825 | 526,693 | 598,531 | 595,118 | 626,136 | 636,673 | 606,064 | 625,840 | 632,625 | 636,993 | 623,873 | 637,586 | 619,256 |
| previous Submission | 459,124 | 591,789 | 688,249 | 562,409 | 616,994 | 613,284 | 643,432 | 654,353 | 624,344 | 643,963 | 650,370 | 653,893 | 638,477 | 649,631 | 626,824 |
| absolute change | -22,345 | -36,911 | -44,424 | -35,716 | -18,463 | -18,166 | -17,295 | -17,680 | -18,281 | -18,122 | -17,745 | -16,900 | -14,604 | -12,045 | -7,568 |
| relative change | -4.87% | -6.24% | -6.45% | -6.35% | -2.99% | -2.96% | -2.69% | -2.70% | -2.93% | -2.81% | -2.73% | -2.58% | -2.29% | -1.85% | -1.21% |
Due to the variety of highly specific tier3 emission factors applied, it is not possible to display any changes in these data sets in a comprehendible way.
For pollutant-specific information on recalculated emission estimates for Base Year and 2020, please see the recalculation tables following chapter 8.1 - Recalculations.
Planned improvements
Besides a routine revision of the underlying model, no specific improvements are planned.


