meta data for this page
This is an old revision of the document!
NFR 6 - Other Sources
6.A Human ammonia emissions from sweating and breathing
Short description
| NFR-Code | Name of category | Method | AD | EF | Key Category |
|---|---|---|---|---|---|
| 6.A | Human ammonia emissions from sweating and breathing | T1 | NS | D |
In addition to animal-related excretion, nitrogen (N) is also introduced into the environment through human consumption of food and later disposed of. Mainly nitrogen is released into the wastewater system in the form of urine, but physiological processes also release nitrogen as ammonia through sweating and respiration. This emission source describes ammonia emissions produced by humans through sweating and breathing.
Methodology
The calculation of ammonia emissions in this area is made for the first time and is based on the methodological description of Visschendijk et al. (2022) 1).
For the complete time series, the emissions are calculated as follows:
EM = AD (number of German inhabitants) * EF (kg emission per inhabitant)
Activity data
The number of inhabitants in Germany is derived from the German statistic Agency (DESTATIS) on an annual basis. The number of people living in Germany at the end of June in a specific year is taken as activity data for that year. As of September 30, 2021, 83,2 million people lived in Germany. The following table shows the population figures over time.
Table 1: Population figures in Germany from 1990 onwards
| Unit | Population |
|---|---|
| 1990 | 79,753,227 |
| 1991 | 79,973,409 |
| 1992 | 80,499,815 |
| 1993 | 80,946,478 |
| 1994 | 81,147,486 |
| 1995 | 81,307,715 |
| 1996 | 81,466,408 |
| 1997 | 81,509,902 |
| 1998 | 81,445,957 |
| 1999 | 81,422,405 |
| 2000 | 81,456,617 |
| 2001 | 81,517,272 |
| 2002 | 81,578,375 |
| 2003 | 81,548,709 |
| 2004 | 81,456,460 |
| 2005 | 81,336,663 |
| 2006 | 81,173,139 |
| 2007 | 80,992,305 |
| 2008 | 80,763,506 |
| 2009 | 80,482,557 |
| 2010 | 80,284,071 |
| 2011 | 80,274,983 |
| 2012 | 80,523,746 |
| 2013 | 80,767,463 |
| 2014 | 81,197,537 |
| 2015 | 82,175,684 |
| 2016 | 82,521,653 |
| 2017 | 82,792,351 |
| 2018 | 83,019,213 |
| 2019 | 83,166,711 |
| 2020 | 83,155,031 |
| 2021 | 83,237,124 |
Emission factor
For the calculation of ammonia emissions in this category, the highest of the emission factors given in Sutton et al. (2000)2) are used, resulting in a total emission factor of 0.0826 kg NH3-N per person per year (according to the assumptions sum of 74.88 (sweating) and 7.7 (breathing) grams NH3-N per person per year, respectively). The higher EFs were used to avoid underestimating emissions. The amount was converted to the amount of ammonia using the stoichiometric factor (17/14).
Emission Trend
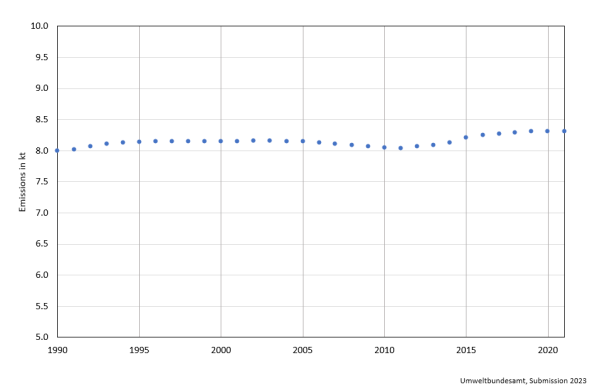
The average value of the last 10 years is 8.21 kt NH3 emissions per year, so this category is not a major source of regional NH3 emissions. The following figure shows the emission trend.
Figure 1: NFR 6.A, Ammonia emissions from human sweat & breath
Uncertainty and Quality checks
The AD from DESTATIS usually have an uncertainty of ± 3%. The uncertainties for the emission factors are estimated to be relatively high, as emission factors vary between different sources and the amount of ammonia volatilized is based on an assumption. Hence the overall uncertainty for the emission estimation of NH3 is qualified estimated by expert judgement to be ± 95%.
Quality checks
No sector-specific quality checks are done.
Further Improvement
Currently no improvements are planned.