meta data for this page
Explanation of Key Trends - Carbon Monoxide
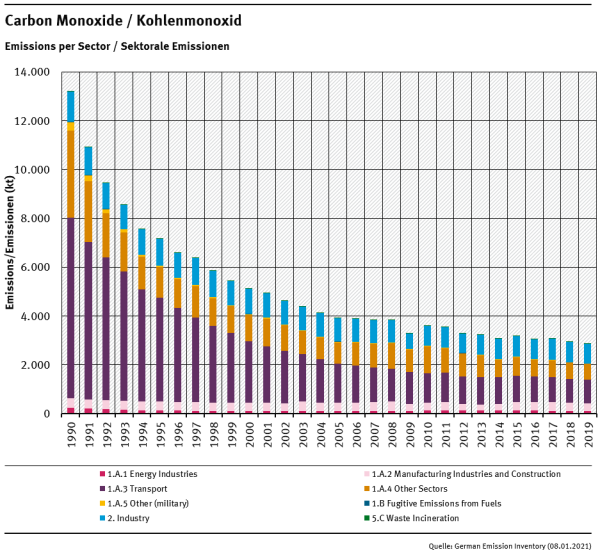
Main drivers
CO total emissions show a falling trend over the whole interval, with emission reductions of 78.2 % between 1990 and 2019 and a stagnation of emission reductions in the last years. The Main Driver for CO emissions is Fuel Combustion (NFR 1.A) with 90% of total 1990 emissions and an 83% reduction between 1990 and 2019. In the Fuel Combustion category, Road Transport (NFR 1.A.3.b) is responsible for 61% of the 1990 emissions, with Passenger Cars (NFR 1.A.3.b.i) emitting nearly all of it. Reductions of about 87% in those categories between 1990 and 2019 are mainly due to constantly improving fuels and increasingly stricter regulations resulting in technical improvements. Other Sectors (NFR 1.A.4, including commercial/institutional and residential sources) are responsible for about 30% of 1990 Fuel Combustion emissions with a 82% reduction between 1990 and 2019.
CO Emissions 1990-2019
| Total Emissions (kt) | Trend: latest compared to | ||||||||||||||
|---|---|---|---|---|---|---|---|---|---|---|---|---|---|---|---|
| 1990 | 1995 | 2000 | 2005 | 2010 | 2011 | 2012 | 2013 | 2014 | 2015 | 2016 | 2017 | 2018 | 2019 | 1990 | last years |
| 13,204 | 7,181 | 5,147 | 3,921 | 3,621 | 3,555 | 3,295 | 3,255 | 3,091 | 3,194 | 3,061 | 3,082 | 2,957 | 2,881 |  -78.2% -78.2% |  |