meta data for this page
Chapter 5 - NFR 3 - Agriculture (OVERVIEW)
Emissions occurring in the agricultural sector in Germany derive from manure management (NFR 3.B), agricultural soils (NFR 3.D) and agriculture other (NFR 3.I).
Germany did not allocate emissions to category field burning (NFR 3.F) (key note: NO), because burning of agricultural residues is prohibited by law (see Rösemann et al., 2021 1).
| NFR-Code | Name of Category |
|---|---|
| 3.B | 3.B Manure Management |
| 3.D | 3.D Agricultural Soils |
| 3.F | 3.F Field Burning Of Agricultural Residues |
| 3.I | 3.I Agricultural: Other |
Short description
Emissions occurring in the agricultural sector in Germany derive from manure management (NFR 3.B), agricultural soils (NFR 3.D) and agriculture other (NFR 3.I). Germany did not allocate emissions to category field burning (NFR 3.F) (key note: NO), because burning of agricultural residues is prohibited by law (see Rösemann et al., 2021)).
The pollutants reported are:
- ammonia (NH3),
- nitric oxides (NOx),
- volatile organic compounds (NMVOC),
- particulate matter (PM2.5, PM10 and TSP) and
- hexachlorobenzene (HCB).
No heavy metal emissions are reported.
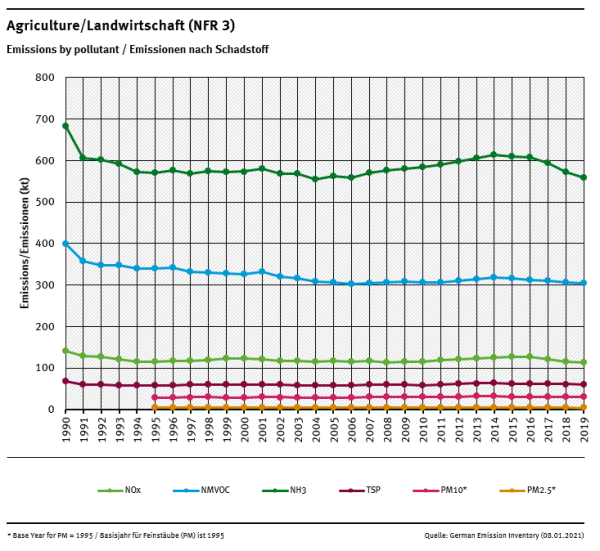
In 2019 the agricultural sector emitted 557.8 Gg of NH3, 112.2 Gg of NOx, 304.4 Gg of NMVOC, 60.3 Gg of TSP, 30.4 Gg of PM10 and 4,4 Gg of PM2.5 and 8.8 kg HCB. The trend from 1990 onwards is shown in the graph below. The sharp decrease of emissions from 1990 to 1991 is due to a reduction of livestock population in the New Länder (former GDR) following the German reunification. The increase of NH3 emissions since 2005 is mostly due to the expansion of anaerobic digestion of energy crops, especially the application of the digestion residues. This is a new emission source which also effects NOx emissions. However, these emissions are excluded from emission accounting by adjustment, as they are not part of the NEC and Gothenburg commitments. The decrease of NH3 emissions since 2015 is mostly due to a decline in the amounts of mineral fertilizer sold. Further details concerning trends can be found in Rösemann et al., 2021, Chapter 2.
As displayed in the diagram below, in 2019 95.1 % of Germany’s total NH3 emissions derived from the agricultural sector, while nitric oxides reported as NOx contributed 9.9 % and NMVOC 27.2 % to the total NOx and NMVOC emissions of Germany. Regarding the emissions of PM2.5, PM10 and TSP the agricultural sector contributed 4.8 % (PM2.5), 14.9 and 15.9 %, respectively, to the national particle emissions. HCB emissions of pesticide use contributed 69.5 % to total German emissions.
Recalculations and reasons
(see Chapter 8.1 - Recalculations)
The following list summarizes, the most important reasons for recalculations. Recalculations result from improvements in input data and methodologies (for details see Rösemann et al. (2021), Chapter 3.5.2).
1) Dairy cows and calves: Adjustment of initial weight, energy requirements and feeding according to German expert recommendations; correction of the calculation of the TAN excretion of dairy cows.
2) Heifers: Subdivision into dairy and slaughter heifers with different final weights; adaptation of energy requirements and feeding according to German expert recommendations.
3) Male beef cattle: Adjustment of feeding according to German expert recommendations; correction of the calculation of the TAN flow into manure storage.
4) Male cattle > 2 years: update (increase) of the amount of bedding material (straw).
5) Cattle grazing: The NH3 emission factors were updated according to EMEP (2019).
6) Sows: Update of the number of piglets per sow in 2018.
7) Fattening pigs and weaners: Update of animal numbers, starting weights and final weights for 2018.
8) All pigs except boars: Update of activity data of air scrubbing systems in pig housings from 2005 onwards.
9) Sheep, laying hens, broilers, pullets: Update of the NH3 emission factors for manure storage according to EMEP (2019).
10) Broilers: Update of the national gross production of broiler meat in 2018; update of activity data of air scrubbing systems in broiler housings from 2013 onwards.
11) Turkeys: Recalculation of the final weights of roosters and hens 1990 to 2001.
12) Anaerobic digestion of animal manures: Update of activity data in all years and of the NH3 emission factors for pre-storage of cattle manure and poultry manure.
13) Mineral fertilizers, liming, application of urea: Annual averaging of activity data (moving centered three-year mean for 1990 to 2018; for 2019 mean from 2018 and 2019).
14) Application of sewage sludge to soils: Update of activity data in 2018.
15) Anaerobic digestion of energy crops: Update of activity data in 2018.
16) Crop residues: Minor corrections of cultivated areas and yields in the years 1999 and 2010 through 2012.
Visual overview
Chart showing emission trends for main pollutants in NFR 3 - Agriculture:
Contribution of NFR categories to the emissions/Anteile der NFR-Kategorien an den Emissionen
Specific QA/QC procedures for the agriculture sector
Numerous input data were checked for errors resulting from erroneous transfer between data sources and the tabular database used for emission calculations. The German IEFs and other data used for the emission calculations were compared with EMEP default values and data of other countries (see Rösemann et al. (2021)). Changes of data and methodologies are documented in detail (see Rösemann et al. 2021, Chapter 3.5.2).
A comprehensive review of the emission calculations was carried out by comparisons with the results of Submission 2020 and by plausibility checks.
Once emission calculations with the German inventory model GAS-EM are completed for a specific submission, activity data (AD) and implied emission factors (IEFs) are transferred to the CSE database (Central System of Emissions) to be used to calculate the respective emissions within the CSE. These CSE emission results are then cross-checked with the emission results obtained by GAS-EM.
Model data have been verified in the context of a project by external experts (Zsolt Lengyel, Verico SCE). Results show that input data are consistent with other data sources (Eurostat, Statistisches Bundesamt / Federal Statistical Office) and that the performed calculations are consistently and correctly applied in line with the methodological requirements.
Furthermore, in addition to UNFCCC, UNECE and NEC reviews, the GAS-EM model is continuously validated by experts of KTBL (Kuratorium für Technik und Bauwesen in der Landwirtschaft, Association for Technology and Structures in Agriculture) and the EAGER group (European Agricultural Gaseous Emissions Inventory Researchers Network).