meta data for this page
Chapter 1.7 - General Uncertainty Evaluation
Introduction

Uncertainties are a key part of any emission inventory effort. Recording and assessing the inevitable errors made in estimating emissions allows for the inventory team to direct their attention as well as for the public and the scientific community to work with the results presented. Germany employs the statistical approaches as defined in the EMEP/EEA Guidebook to evaluate its inventory's uncertainties. The Guidebook offers two methods for the combination of individual source uncertainties to the level of categories and national totals, namely error propagation (EP, tier 1) and Monte Carlo simulation (MC, tier 2). Although Germany presents all results from both approaches here, the MC values are generally considered to represent the actual confidence interval more precisely.
An important aspect of an uncertainty analysis concerns the ways on how to express the uncertainties associated with individual estimates or the total inventory. It is recommended to use the same quantity to express uncertainty in a LRTAP Convention inventory as required in a greenhouse gas inventory, namely the 95% confidence interval. The confidence interval is specified by the confidence limits defined by the 2.5 percentile and 97.5 percentile of the cumulative distribution function of the estimated quantity, that means that there is a 95% probability that the actual value of the quantity estimated is within the interval defined by the confidence limits. For a normal distribution, the 95% confidence interval lies between ±2 standard deviations around the mean.
The data presented in this chapter are derived from the work of the emissions inventory experts contributing to the German emission inventory, who picked a confidence interval and a probability distribution function for each of the ~2,000 activity data and ~20,000 emission factor time series employed. In practice, every time series receives a metadata record in the database comprised of upper limit, lower limit and distribution function as well as an uncertainty information source reference (e.g. EEA/EMEP GB 2019, other literature or expert judgement). However, while uncertainties are currently considered separately for each individual time series, they remain static for each series across years. On this basis, the combination approaches described above are used to derive uncertainty information at the level of categories and national totals.
Uncertainty overview
Germany currently reports detailed uncertainty information for five pollutants: NOx, SO2, NMVOC, NH3 and PM2.5. While detailed spreadsheet tables are available for download below, the following table offers a quick overview and comparison per pollutants at the level of the national totals:
| Base year [kt] | 2019 [kt] | Trend [%] | Method | Base year uncertainty [%] | 2019 uncertainty [%] | Trend uncertainty [%] | ||||
|---|---|---|---|---|---|---|---|---|---|---|
| NOx | 2,850 | 1,137 | -60.11 | EP | 27.53 | 18.03 | 13.20 | |||
| MC | -10.83 | +14.23 | -8.65 | +14.07 | -16.78 | +19.78 | ||||
| SO2 | 5,474 | 264 | -95.19 | EP | 8.69 | 8.33 | 1.77 | |||
| MC | -8.02 | +8.94 | -6.47 | +6.87 | -1.84 | +1.96 | ||||
| NMVOC | 3,891 | 1,121 | -71.18 | EP | 23.36 | 31.31 | 21.22 | |||
| MC | -14.58 | +22.58 | -15.22 | +29.25 | -22.98 | +32.18 | ||||
| NH3 | 715 | 587 | -17.96 | EP | 12.69 | 10.26 | 13.90 | |||
| MC | -10.19 | +11.70 | -9.49 | +9.86 | -336.77 | +364.82 | ||||
| PM2.5 | 206 | 92 | -55.29 | EP | 22.95 | 37.65 | 23.81 | |||
| MC | -10.72 | +12.82 | -16.54 | +19.03 | -16.90 | +19.53 | ||||
Uncertainties per pollutant
The sections below detail pollutant specific uncertainty interpretations and show the values in the context of the pollutant's emissions and trends.
NOx
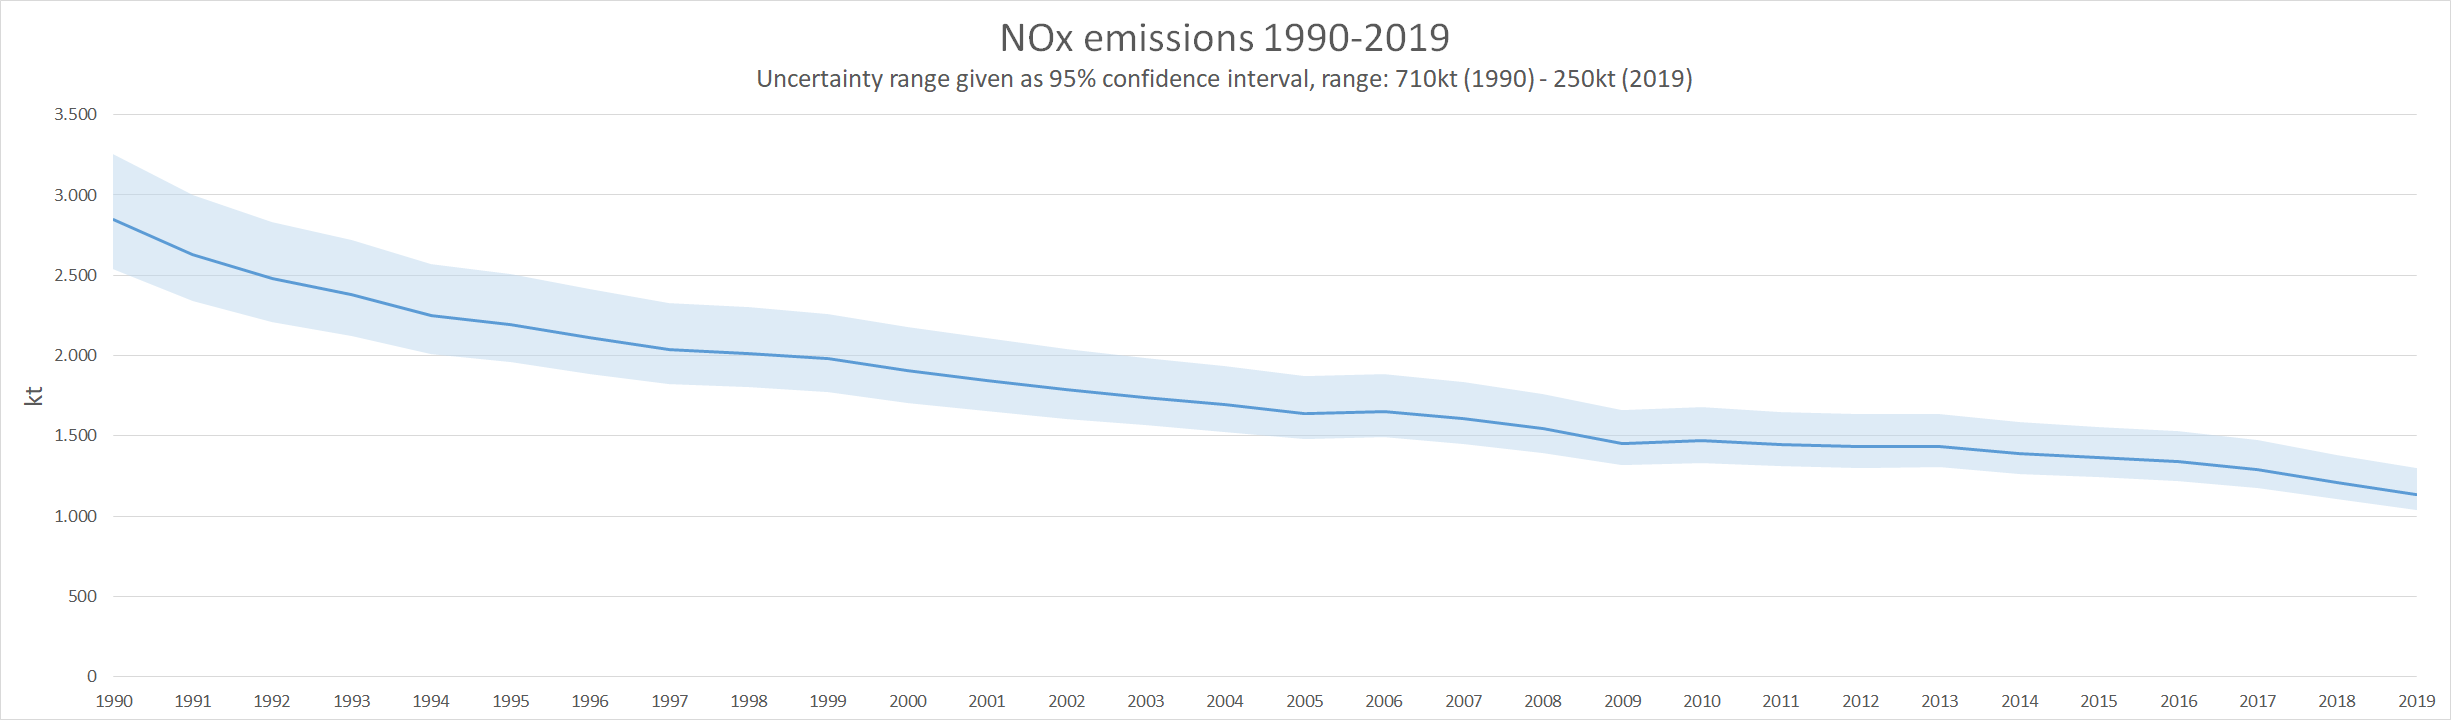
Compared to other pollutants, NOx emission uncertainties are moderate. The national total has a 95% confidence interval of about -8.7% to +14% in 2019, which amounts to about 250kt of NOx. Interestingly, with NOx, the differences between the two approaches in uncertainty combination (EP and MC) are particularly visible. This is because of the highest contributing sector 3.D - Agricultural Soils, where emissions and uncertainties are high (> +300%) and, crucially, do not follow a normal distribution. Therefore, only the MC simulation, which takes the log-normal distribution of these emissions into account, correctly reflects this source, while the EP yields unrealistic high uncertainties at more than 18%.
Using the MC simulation, the top three contributors to the overall uncertainty are 1.A.3.b i - Road transport: Passenger cars, 3.D.a.1 - Inorganic N-fertilizers and 3.D.a.2.a - Animal manure applied to soils. 1.A.4.b.i - Residential: Stationary and 3.D.a.2.c - Other organic fertilisers applied to soils are other important sector in regard to NOx overall uncertainties. Please refer to the spreadsheet file for details.
SO2
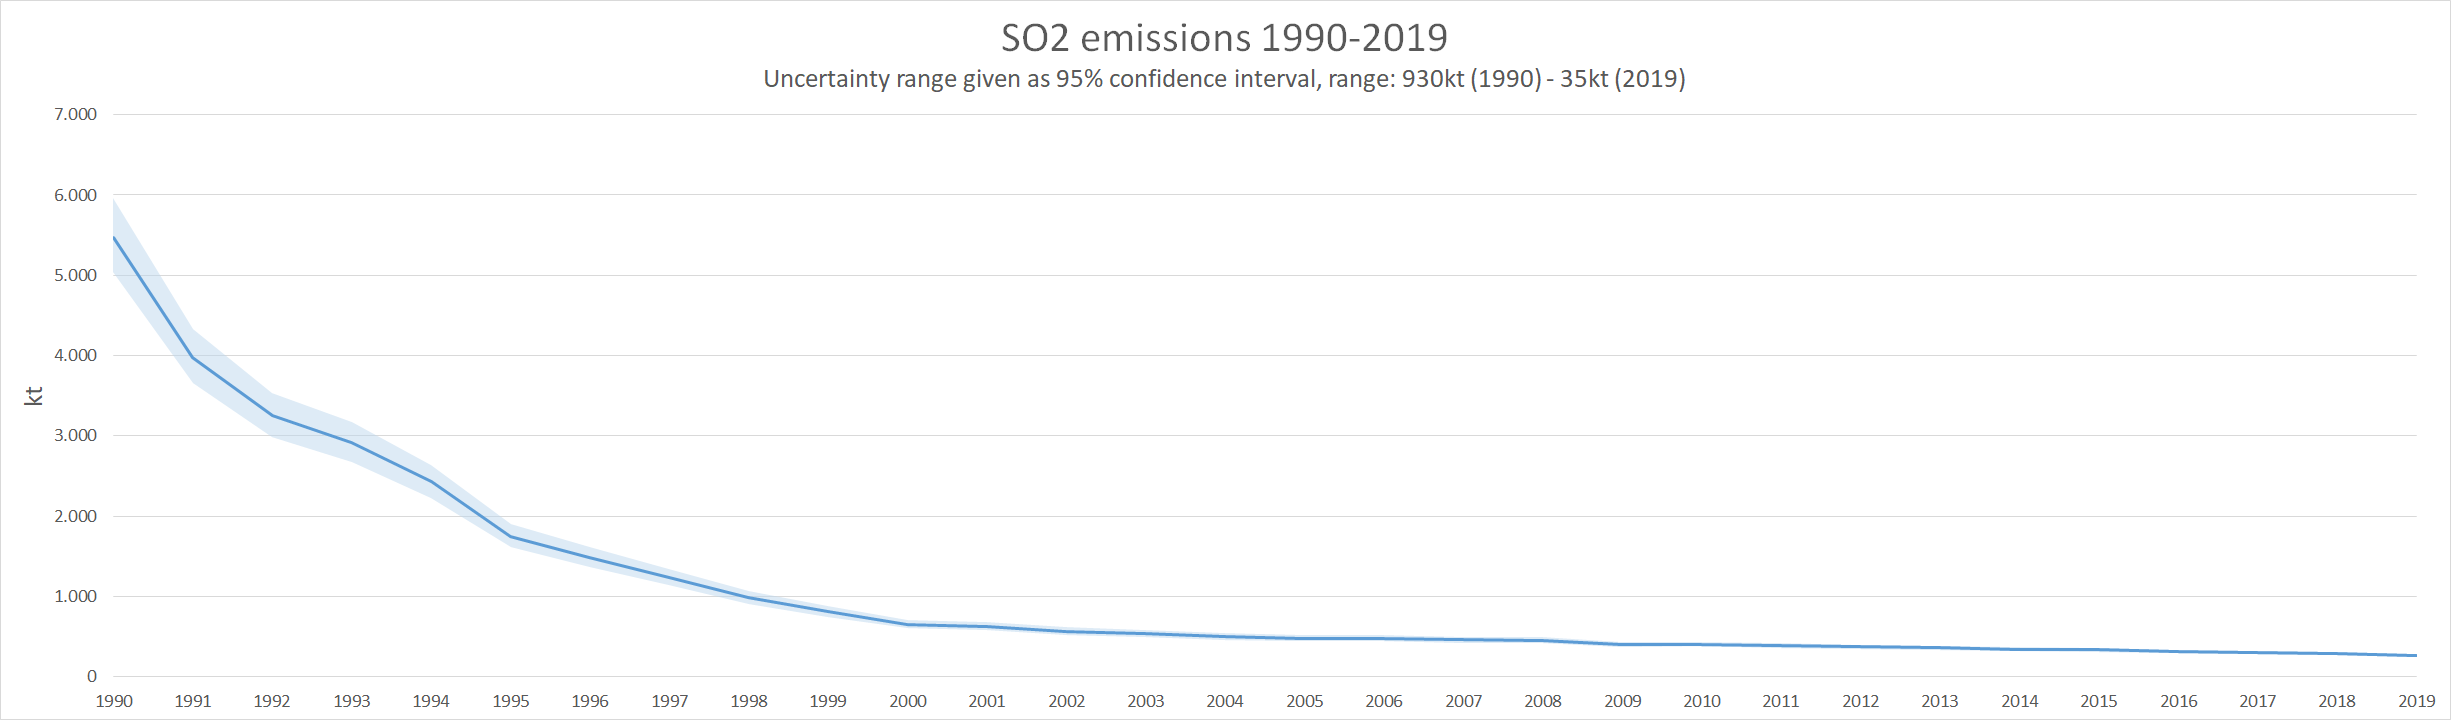
SO2 emissions are mainly emitted by stationary combustion plants. Since those are heavily regulated and fuel sulphur contents are generally well known, uncertainties in SO2 emissions are low. The national total has a 95% confidence interval of about -6.5% to +6.9% in 2019, which amounts to about 35kt of SO2. The top contributing sector to the SO2 uncertainties is 1.A.1.a - Public Electricity And Heat Production, followed by a rather big margin by 1.A.1.b - Petroleum Refining, 1.A.4.b i - Residential: Stationary Combustion, as well as 2.C.1 - Iron and Steel Production. All data is available in the spreadsheet file.
NMVOC
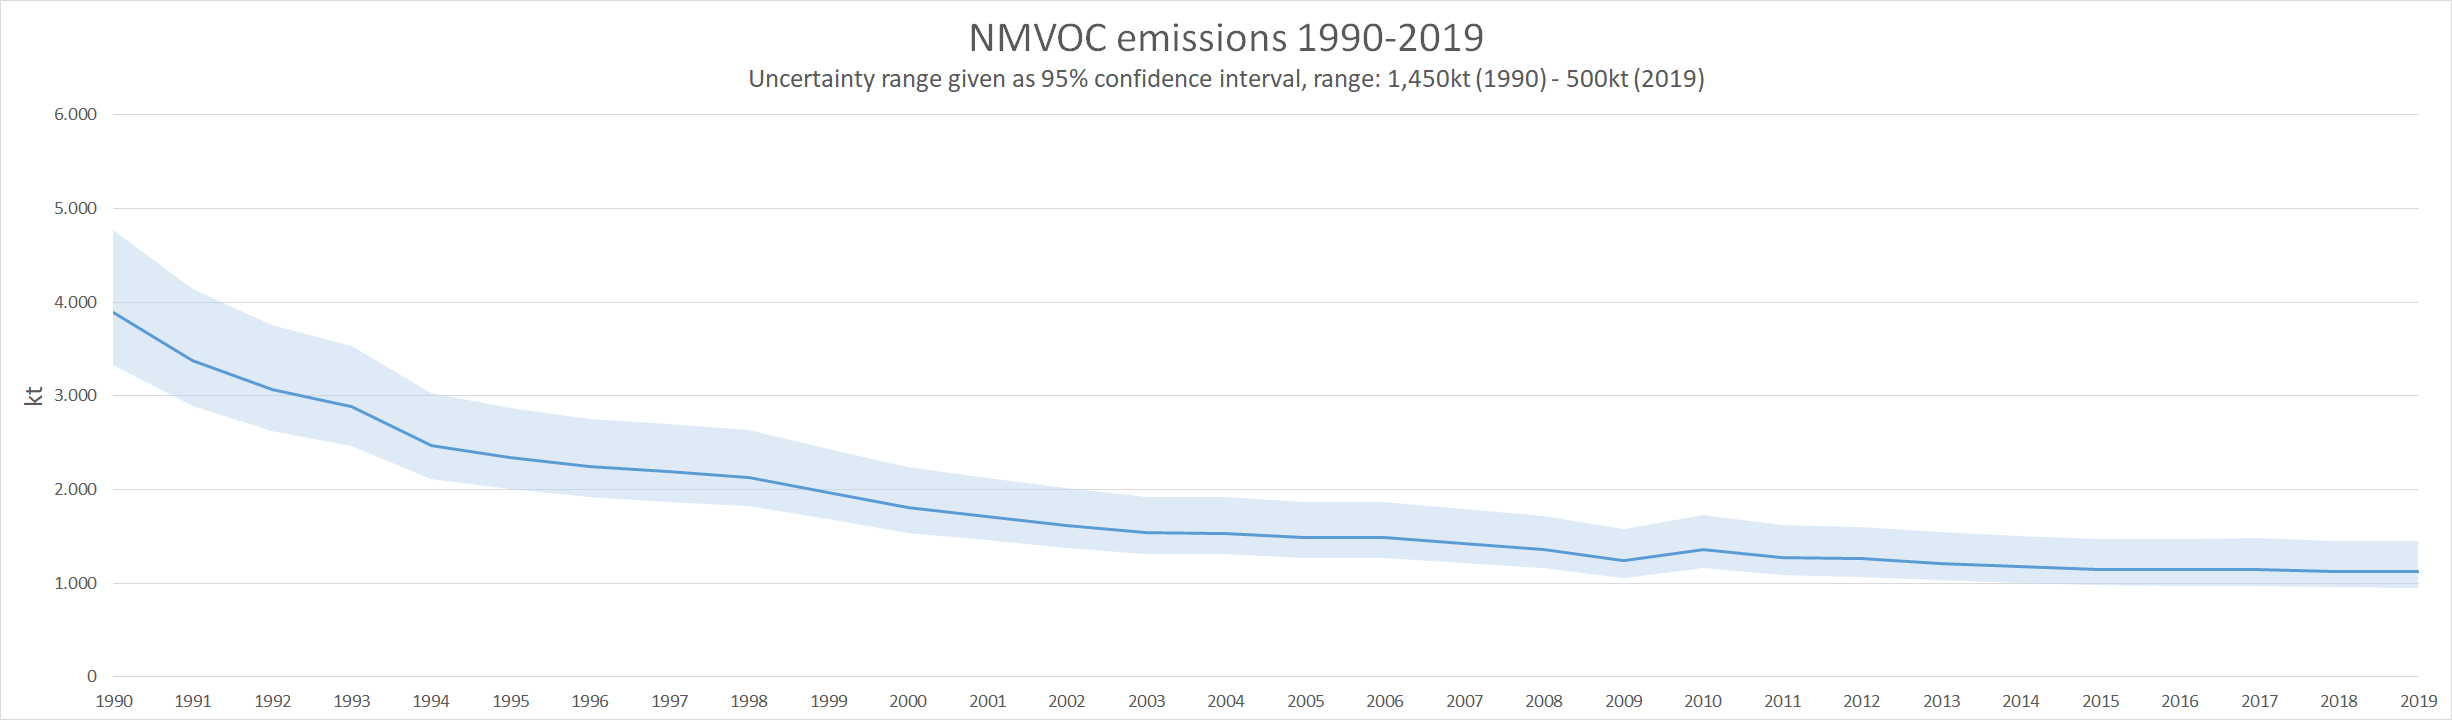
NMVOC emissions and trends are driven by solvent use. While solvent contents of most products are well known, application context and use statistics introduce significant model error bars. Agriculture emissions of NMVOC are, while not very high in value, very uncertain and also contribute to the overall error margins. In sum, NMVOC emissions show moderate to high uncertainty. The national total has a 95% confidence interval of about -15% to +29% in 2019, which amounts to about 500kt of NMVOC. In order of significance, the top five contributors are 3.B - Manure Management - Dairy cattle, 3.B.1.b Manure management - Non-dairy cattle, 2.D.3.a - Domestic Solvent Use, including Fungicides, 1.A.4.b.i - Residential: Stationary Combustion as well as 2.D.3.d - Coating Application. As with the other pollutants, details are to be found in the spreadsheet file.
NH3
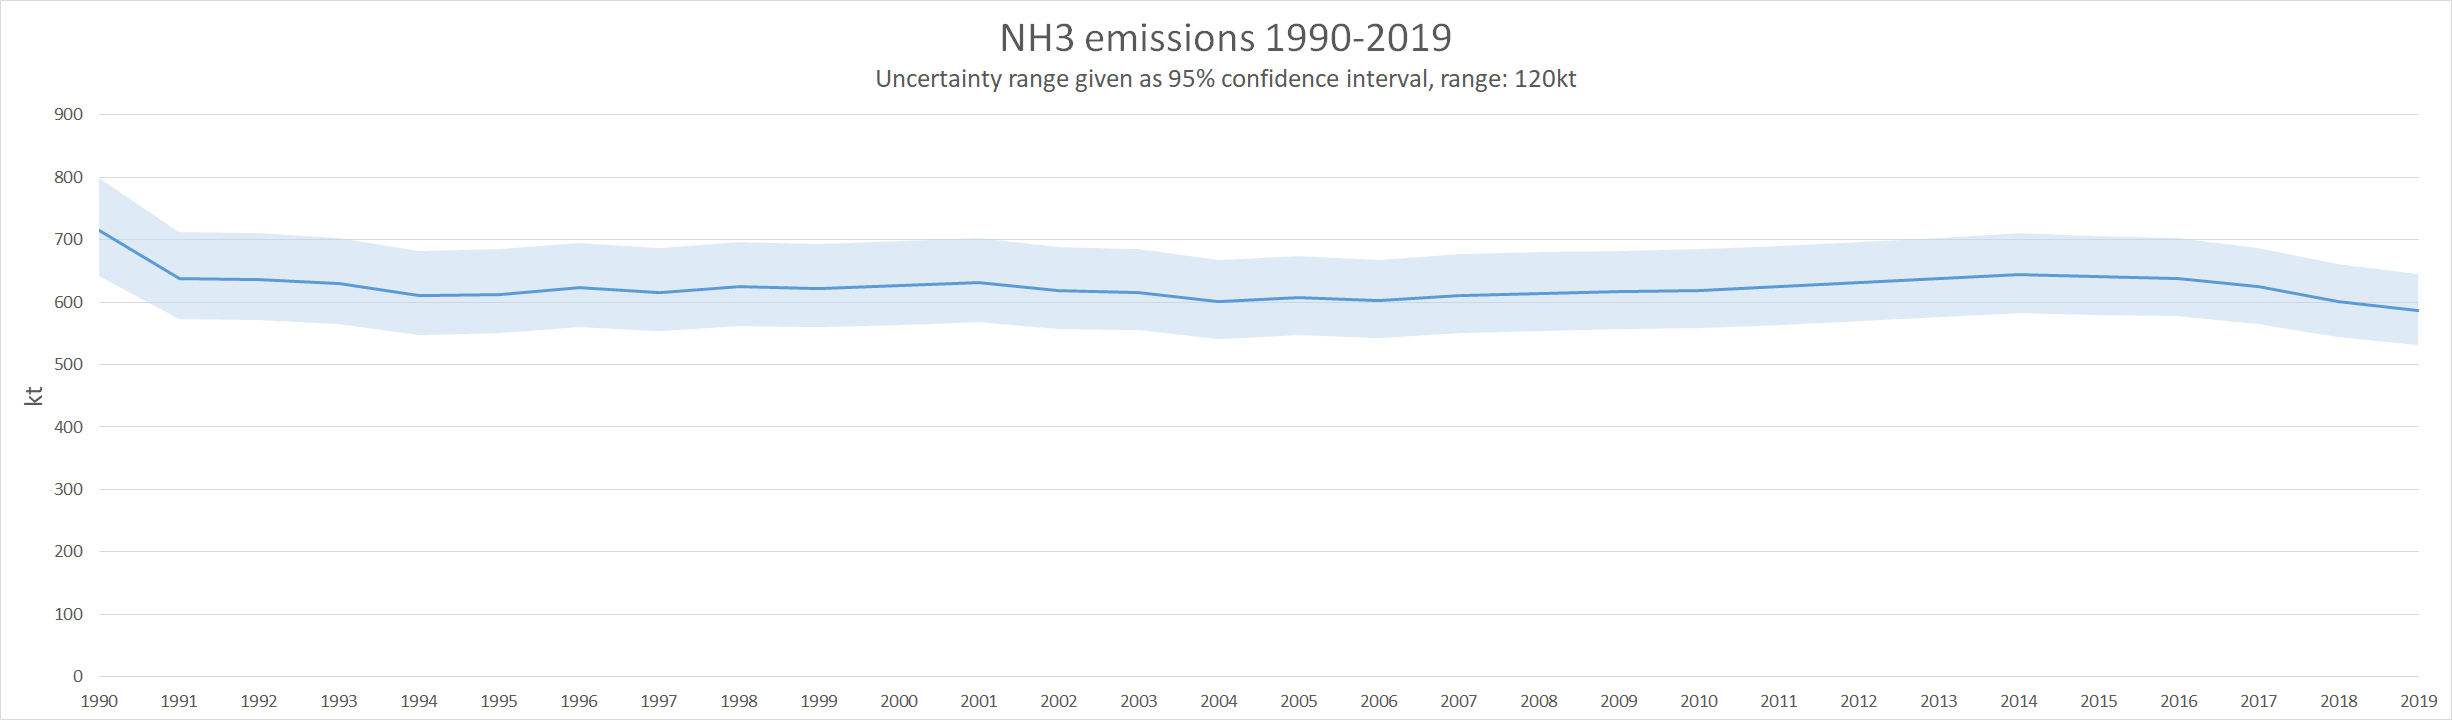
Uncertainty in the NH3 emission national total is moderate and mainly caused by agriculture sources, in particular 3.D.a.2.a - Animal manure applied to soils. 3.B.3 - Manure management - Swine and 3.D.a.1 - Inorganic N-fertilizers do also play significant roles. The national total has a 95% confidence interval of about -9.5% to +9.9% in 2019, which amounts to about 120kt of NH3. You can drive your own analysis with the numbers found in the spreadsheet file attached.
PM2.5
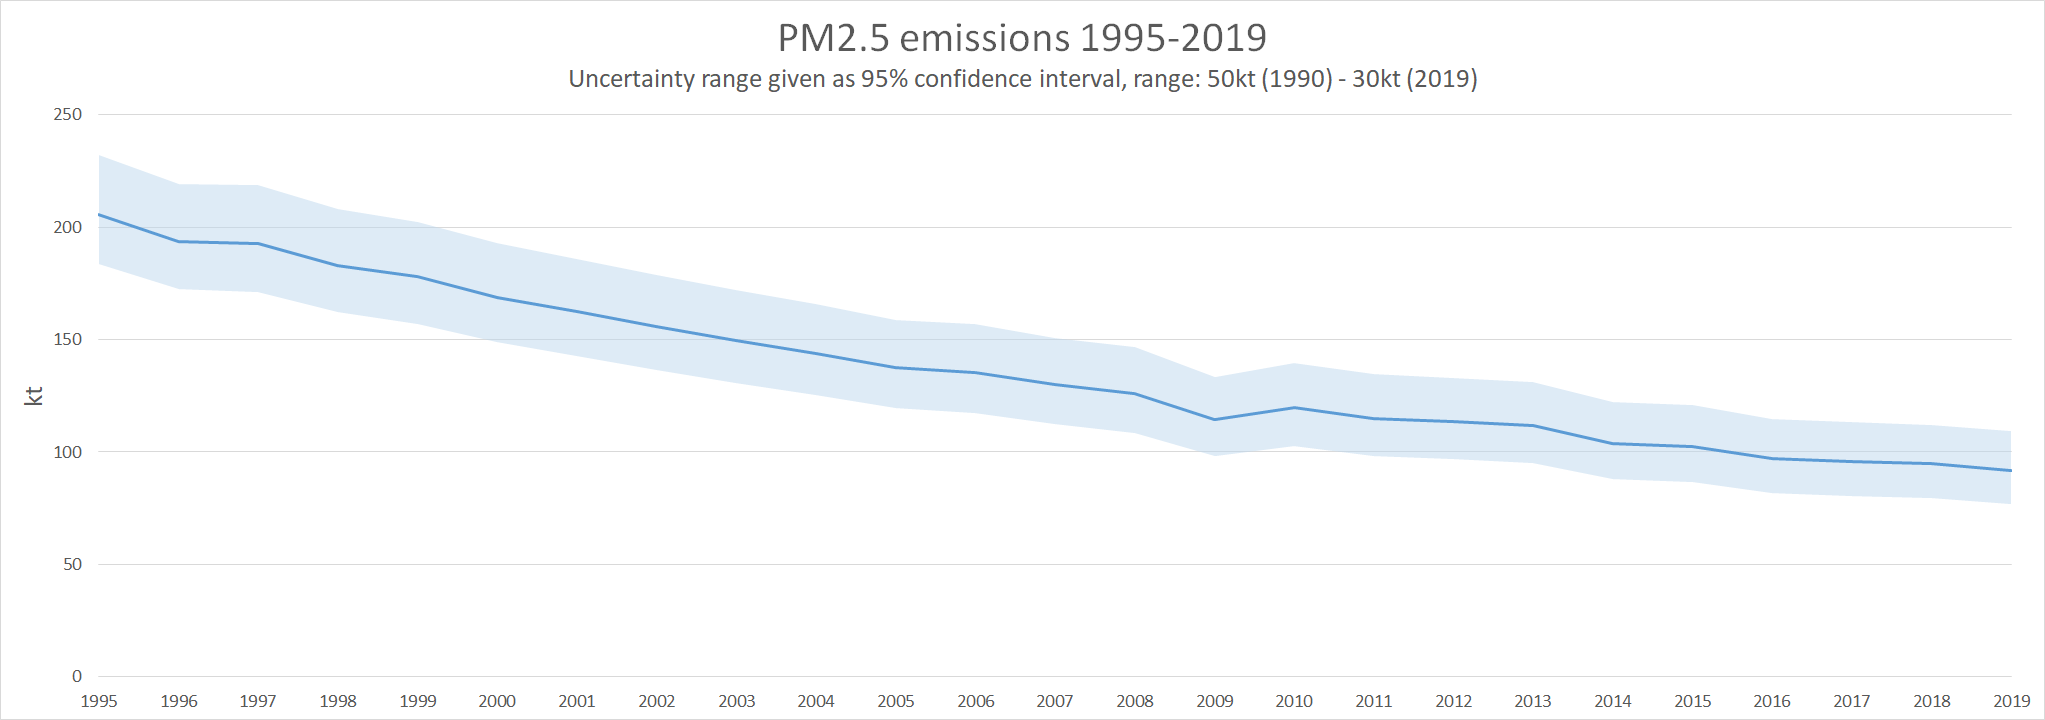
PM2.5 emissions are associated with high uncertainties. The national total has a 95% confidence interval of about -16.5% to +19% in 2019, which amounts to about 30kt of PM2.5. Two sectors contribute the bulk of these errors: 1.A.4.b.i - Residential: Stationary Combustion and 2.L - Other production, consumption, storage, transportation or handling of bulk products. Germany is also one of the few countries that reports abrasion under 1.A.3.c - Transport: Railways, adding noticeably to both emission values and uncertainties. Please refer to the spreadsheet file for details.
Other pollutants
There is currently no uncertainty assessment for additional air pollutants, heavy metals and POPs. Germany seeks to expand the list of pollutants covered as resources allow.