meta data for this page
Explanation of Key Trends - Sulfur Dioxide
Obligations
Under the terms of the UN ECE Geneva Convention on Long-range Transboundary Air Pollution Control (CLTRAP, 1979), the Federal Republic of Germany was obliged by the UN ECE Helsinki Protocol to reduce its annual sulphur emissions by at least 30% by 1993, as compared to 1980 levels. In 1993, the SO₂ emissions were 2.9 Mt, compared to approximately 7.5 Mt in 1980. This represents a reduction of 61%. The second UN ECE protocol on the reduction of sulphur emissions obliged Germany to reduce SO₂ emissions to 1,300kt by 2000, and to 990kt by 2005. The targets set for 2000 & 2005 have already been achieved by 1998.
More recently, Germany has made a commitment under the multicomponent protocol to further minimise SO₂ emissions. Since 2010, it is no longer permissible to exceed a National Emission Ceiling of 550kt SO₂ for Germany as whole. The revised Gothenburg Protocol and the revised NEC Directive both define emission reduction targets relative to a 2005 base year, mandating 21% (2020) and 58% (2030) reductions respectively.
While Germany's compliance with these obligations is not discussed here, further information on this subject can be found in Chapter 9 - Projections and Chapter 11 - Adjustments and Emission Ceiling Exceedance.
Main drivers
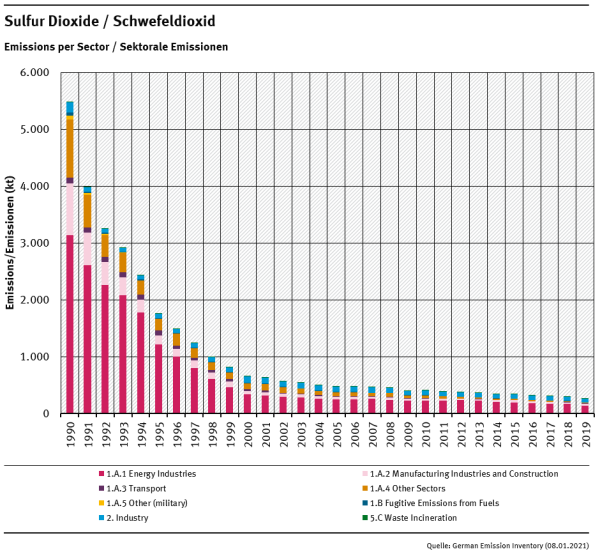
By far the largest proportion of SO₂ is produced by the oxidation of the sulphur contained in the fuels used in combustion processes, Fuel Combustion (NFR 1.A) with close to 96% of total SO₂ emissions in 1990 and a 96% reduction between 1990-2019. In 1990, the biggest source of emissions therein is Public Electricity and Heat Production (NFR 1.A.1.a) with about 60% of the emissions from Fuel Combustion (NFR 1.A). Other sources substantially influencing the SO₂ emission trend are Manufacturing Industries and Construction (NFR 1.A.2) and Other Sectors (NFR 1.A.4, including commercial/institutional and residential sources), each adding about one fifth of 1990 emissions from Fuel Combustion (NFR 1.A). All of these sub-categories show a reduction >95 per cent between 1990 and 2019, due to stricter regulations of West Germany that applied to the New German Länder after the German Reunification and changed the fuel mix from sulphur-rich solid fuels to liquid and gaseous fuels.
SO₂ Emissions 1990-2019
| Total Emissions (kt) | Trend: latest compared to | ||||||||||||||
|---|---|---|---|---|---|---|---|---|---|---|---|---|---|---|---|
| 1990 | 1995 | 2000 | 2005 | 2010 | 2011 | 2012 | 2013 | 2014 | 2015 | 2016 | 2017 | 2018 | 2019 | 1990 | last years |
| 5,475 | 1,752 | 651 | 477 | 405 | 389 | 372 | 360 | 339 | 336 | 311 | 303 | 292 | 263 |  -95.2% -95.2% | |