meta data for this page
Chapter 10.2 - Gridded Data
Information on the spatial distribution of emissions is important to answer a number of questions in the field of air quality monitoring. Emission data is used to model the dispersion of air pollutants or to visualize the structure of the spatial distribution of emissions. These models show if abatement strategies were successful. For this reason, an ESRI ArcGIS based software has been developed which allows the UBA, independently and on the basis of information generally available, to regularly generate regionalized emission datasets for the complete area of the Federal Republic of Germany.
The following pollutants are currently considered: NOₓ, NH₃, SO₂, CO, NMVOC, particles (PM₂.₅, PM₁₀,TSP, BC) and Heavy Metals (HM), POP (PAH, HCB, PCB, PCDD/PCDF - dioxins/ furans).
Methodology
- The Gridding Emission Tool for ArcGIS (GRETA) contains a complete set of the required data per base year. This includes emissions, distribution parameters, geometric datasets as well as the necessary definitions and allocation tables.
- The emission data could be distributed using the energy-balanced principle (fuel sold) or inland principle (fuel used). The energy-balanced principle (fuel sold) is used for the official reporting of spatial distributed emissions for Germany.
- The geometric and statistical data, which is used for the spatial distribution, is available for different base years (1990 – 2019). For example, the traffic network and annual mileage data is updated in a 5-year cycle. Land use / land cover datasets (CORINE Land Cover) are used for different reference years. From 2000 onwards, information about point sources is available from the German PRTR or the EPER. For the earlier years 1990 and 1995, information from point sources was transferred from EPER data of the year 2001 and their emissions were scaled accordingly.
- For each NFR sector, the spatial distribution of the national emissions is determined using distribution parameters, and if possible, as point sources (PQ) and line sources (LQ). The remaining emissions are spatially assigned to distribution parameters on district level and further, considering land cover data, on area level (FQ).
The calculation can be carried out for different arbitrary grid widths and different coordinate reference systems. In Greta, only the national totals are currently distributed. The memo items are not considered yet. The software and methodology is documented in detail and complies with high standards as to its flexibility and extensibility (see detailed description Gridding Tool). The following description is taken from the summary of the report.1).

Significant factors for spatial distribution of national emissions are the so-called distribution parameters. These are characterized in the context of the Gridding Tool as follows:
- A distribution parameter represents a function that fully distributes a total number of emissions (e.g. national emissions Germany) to a specific amount of regional objects.
- The spatial distribution of national emissions is being performed per NFR sector;
- More complex distribution parameters distribute the emissions, for example, to different spatial object classes or by considering a further differentiation of the total emissions.
- For each NFR sector emissions are spatially distributed over one or more distribution parameters. For this purpose it has to be determined which part of the emissions is to be distributed over which distribution parameter.
Distribution parameters are used for allocation of national emissions, spatially as accurately as possible, to individual point, line or area sources depending on the source group. The location of a point source is given clearly by coordinates; typical line sources are, for example, streets, which can consist of many sections. As surface sources such areas are defined in which from many small sources emissions are released, for example, emissions from small combustion plants in built-up areas. A substantial database for distribution of national emissions in the sectors ‘energy supply’ and ‘industry’ are the emissions of individual sites or plants from the PRTR database. In addition, for example, also emissions of air traffic are allocated to point sources by location of the airports, whereas in the case of larger airports an additional local distribution is considered. Emissions from road traffic, rail traffic and inland water navigation are spatially assigned to line sources. The respective route networks consist of individual sections. To each of these network segments (line source) a share of the national emissions is assigned.
The spatial distribution of the emissions that are not distributed to point sources or line sources, is carried out in two steps on area sources. In the first step, these emissions are distributed by means of suitable distribution parameters to the district level.In the second step a more accurate spatial allocation of emissions using land cover data is carried out within the districts. Per NFR sector the areas of the relevant land use classes are chosen and only to these areas emissions are allocated. Here, emphasis can also be placed on different CLC groups, e. g. the land-cover class ‘residential areas’ could get a higher rating than land-cover class ‘residential areas loose’. As a result, the previously at district level distributed national emissions are now spatially localized to the relevant land-cover areas within the districts.Aim of the spatial distribution of emissions is the compilation of emissions in a defined grid. For this, the emissions, spatially distributed to individual point, line and area sources, are assigned to the grid cells of the selected grid in a further step. After determination of the coordinate reference system and grid size of the raster, the share of each emission source (point / line / area source) per grid cell is determined. The summation of the emissions of all source shares lying within a grid cell leads to the total of emissions of the grid cell. The spatial distribution of emissions is not only limited to horizontal distribution, but also includes distribution to vertical height levels. Therefore, it was necessary to assign to each source category or to each NFR sector an average characteristic emission height above ground.
Table 1: Description of the distribution parameters, greta_nfr_verteilparameter_202111104_out.xlsx
Distribution Parameters
Determination of Distribution Parameters
The PRTR database of UBA (PRTR = Pollutant Release and Transfer Register; Thru.de) represents an important data source for the spatial distribution of national emissions. The emissions contained in this database are on hand as point source emissions and are considered as such for the spatial allocation in the Gridding Tool. Furthermore, it was established in agreement with the UBA that the data of the digital landscape models Germany of the Federal Agency of Cartography and Geodesy (BKG) are used as essential data sources. In detail, these are as follows:
- administrative boundaries (district boundaries, municipal boundaries)
- road network
- streaming water network
- rail network
- location of airports
- land-cover differentiated by classes.
As another relevant data source for spatial allocation of emissions that are not assigned by point or line sources, the Corine Land Cover (CLC) data set was stipulated. These data are differentiated in 43 land cover classes. For the usage within the scope of the Gridding Tool these have been merged to 6 CLC groups. Apart from these essential geometric base data sets, further information and data were used for deriving the final distribution parameters. These are, for example, data at district level as to the number of inhabitants or number of employees per business division. The aim was to use per NFR sector those data on the spatial distribution that reflect well the spatial structure of the emission distribution. This also includes typical (effective) vertical heights of sources per NFR sector.
Source categories
Energy and Industry
For the Gridding Tool a methodology has been developed considering PRTR emissions in the spatial distribution of national emissions. Here, the PRTR emissions are first subtracted at a national level from the national emissions. The share of emissions, which is covered by the PRTR emissions, is spatially assigned by the location of PRTR point sources. To avoid negative national residual emissions, this calculation must be made on an aggregated level. For this, the following main groups were defined:
- main group A (energy sector PRTR 1)
- main group B (industrial sectors, PRTR sectors 2,3,4,5,6,8,9)
- main group C (intensive livestock production and aquaculture, PRTR industry 7).
The NFR sectors for which part of the emissions are spatially allocated by means of the PRTR point sources belong to the source groups of energy supply, industry, agriculture and sewage / waste disposal. For the hereby affected NFR sectors, the national (residual) emissions are distributed in a first step by suitable distribution parameters on district level. The distribution parameters are predominantly based on statistical data on numbers of employees in the various sectors and departments of industry. Within the districts, the emissions are distributed via land cover class CLC121 (Industrial and Commercial Units) to the level of area sources.
Other Non-industrial Combustion Plants
The emissions from non-industrial combustion plants (private households, other small consumers, military, agriculture, etc.) are completely spatially distributed over area sources. For this source group, distribution parameters are mainly based on statistical data at district level. The spatial distribution of emissions from small combustion plants of households was carried out via a more complex distribution function since the national emissions are differentiated into the four sub-categories of oil, gas, wood and other solid fuel combustion plants. Then the emissions per energy source are distributed using different distribution parameters to the district respectively community levels. Within the districts (for wood firing within the communities) emissions are again distributed over the relevant CLC classes to the level of the area sources.
Traffic or Transport
For the traffic or transport sector (road, rail, shipping, aviation), at UBA emissions are being determined by means of the TREMOD model. These data are available in a more differentiated way than they are shown per NFR sector in national emissions. Therefore, suitable additional information from TREMOD for the spatial distribution is considered in the Gridding Tool. For the spatial distribution of national emissions of aviation, in addition to the national totals, additional TREMOD emission data for the 26 largest airports are available. These emissions are spatially allocated directly to their position. For the remaining smaller airports and landing sites in Germany, the national residual emissions from aviation, which are not listed in the TREMOD data separately for each airport, are spatially distributed over the number of flight movements per airport. The location of airports is known as a point source. In addition, for the 15 largest (international) airports in Germany the landing and departure sectors were digitized as funnel-shaped three-dimensional sources. This allows a much differentiated spatial distribution of the emissions to local (three-dimensional) sources for these airports. Emissions of the source group Road Traffic are composed of exhaust emissions, emissions from abrasions (tires, brakes, roads) and emissions due to fuel evaporation. The exhaust and abrasion emissions from road traffic are fully distributed over line sources, since a digital geometric data basis exists for all roads. The distribution parameter for spatial distribution of emissions derived from data on mileage per route section. For this purpose, data was processed from different data sources. The evaporative emissions are spatially distributed over area sources to the built-up areas. For rail traffic, emissions resulting from operation of diesel locomotives are reported. Abrasion-emissions caused by both, electrically and diesel-powered trains are currently not included in the reported emissions and are therefore not taken into account in the sector here under consideration. The distribution of emissions of rail transport is carried out entirely on line sources. The geometric base is the rail network and significant data base for the derivation of the distribution parameters are the section-related emissions of DB Umwelt AG. Also, the emissions of shipping traffic are completely spatially distributed on line sources. For this purpose, the digital routing network of watercourses as well as the distribution parameters derived from emission data from TREMOD are being applied.
Offroad / Mobile Machinery
This source group includes emissions which are released by the off-road traffic (e.g. in the building and construction industry, forestry and agriculture) and by the use of mobile devices and machines. The emissions from these source categories are allocated completely as area sources. The distribution parameters are mainly based on statistical data at district level.
Solvents and other Product Use
Emissions that are released by application of solvent-based and other products in the private sector as well as in industrial and other sectors, are fully distributed as area sources. The distribution parameters are predominantly based on statistical data at district level, e.g. employees in economic departments of G-U (Trade and Services) or inhabitants.
Agriculture
Emissions from agriculture consist of the emissions arising from animal husbandry (e.g. cows, pigsetc.), and the emissions that occur during agricultural activity on arable land and pastures. An important data source for spatial distribution is the data of the Thünen Institute, which annually determines the emissions from agriculture at district level for Germany. In addition, emissions from stables that underlay reporting obligations are reported in the PRTR database. They only cover a small proportion of national emissions in agriculture. Therefore, a synthetic stable point source dataset was derived from the German Land Cover dataset (LBM-DE) to distribute the stable (and storage) emissions directly to the stables as point source (PQ). In the past these emissions were distributed to agricultural areas (FQ). To derive the distribution parameters used in the Gridding Tool for the affected NFR sectors, the data of the Thünen Institute, from the PRTR database and synthetic stable point source dataset were considered.
Other NFR Sectors
There are some more NFR sectors, e.g.: 1A4ciii (national fishing), 1B2av (distribution of oil products) and 1A3ei (pipeline compressors), which do not belong to the source groups already described. The distribution parameters for these sectors are based on different data; emissions are predominantly spatially distributed as area sources.
Recalculations / Improvements
The Gridding tool GRETA is constantly being further developed.
- Update of base years (PRTR, emission data, statistical data, etc.),
- QA/QC procedures,
- Distribution of new pollutants TSP, BC, HM, POP (PAH, HCB, PCB, PCDD/PCDF (dioxins/ furans),
- Using synthetic stable point sources (derived from national land cover data) to distribute stable (and storage) emissions to point sources,
- For the earlier years 1990 and 1995, information from point sources was transferred from EPER data of the year 2001 and their emissions were scaled accordingly.
Results with the EMEP grid
The results are available via the Central Data Repository CDR maintained by the EEA/EIONET. In 2019, the calculation tools for the gridding data were updated and new data were stored on the CDR for the years 1990, 1995, 2000, 2005, 2010, 2015 and 2019 (see the data).
The spatial resolution of reported emissions changed from a 50 x 50 km2 EMEP to a 0.1° × 0.1° long-lat grid in a geographic coordinate system (WGS84). The change should improve the monitoring quality. The new EMEP domain covers the geographic area between 30°N-82°N latitude and 30°W-90°E longitude. More information about the grid development is available under EMEP grid.
Maps
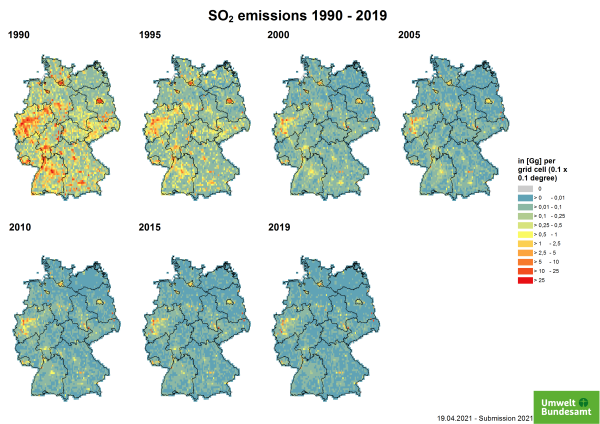
Acidification, eutrophication and Ground-level Ozone pollutants: Sulphur (SO2), nitrogen oxides (NOx), carbon monoxide (CO), ammonia (NH3) and volatile organic compounds (VOCs).
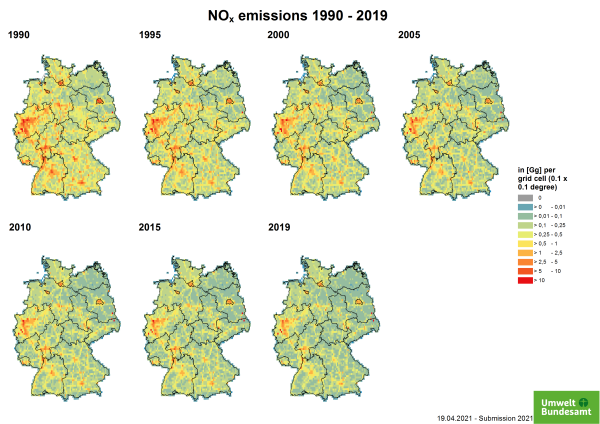
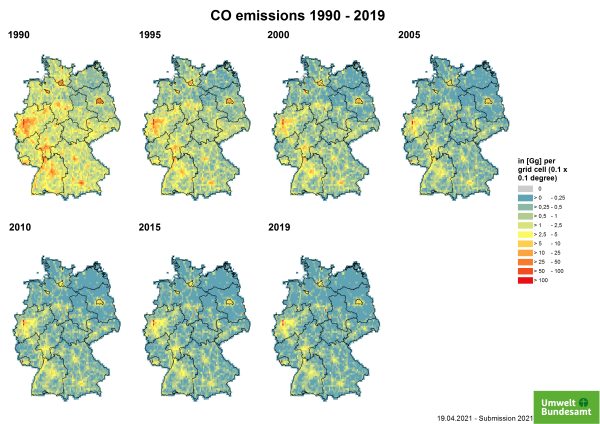
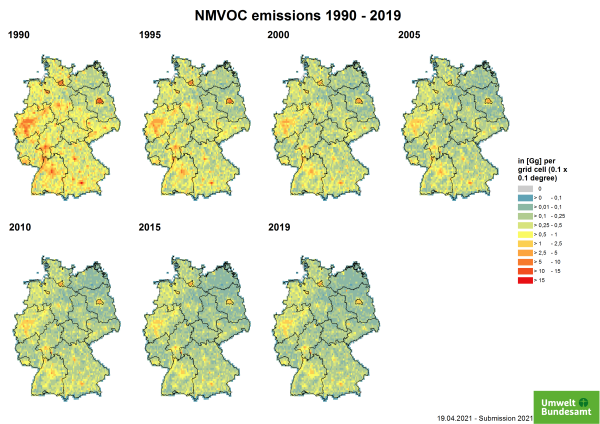
The significant emission reduction history can be visualized with the following grid maps for the years 1990, 1995, 2000, 2005, 2010, 2015 and 2019. From 2000 onwards, information about point sources is available from the German PRTR or the EPER. For the earlier years 1990 and 1995, information from point sources were transferred from EPER data of the year 2001 and their emissions were scaled accordingly. By presenting the spatial distribution of emissions, the emission hotspots can be precisely identified for all pollutants. In general, these are located in the German cities (eg Berlin, Munich or Hamburg) or the conurbations (district of the Rhine-Ruhr area). The reduction measures of SO2 emissions are a success story in itself. In the early 1970s, the use of flue gas desulphurization plants in coal-fired power plants and later brown coal power plants led to a significant SO2 decrease in the air. Since the 1990s, this reduction process has been further advanced by the use of low-sulfur fuels, so that today only a few areas are contaminated with SO2.
NOx and CO emissions are not only generated in the energy but also in the transport sector. This is easily recognisable from the motorway structure.
The main emitters of NMVOC are the industrial process sector and agriculture. The latter is mainly assigned to area and not to point sources.
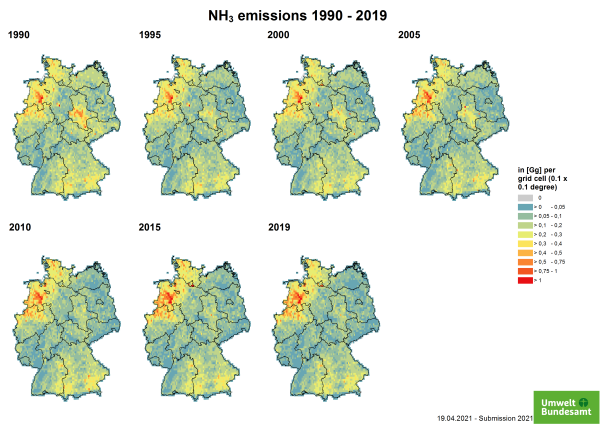
Compared to the above mentioned air pollutants, drastic reduction of ammonia emissions did not occur in the last decades and abatement measures are still a political issue. The highest ammonia emissions occur in rural areas, especially in the north-west of Germany. The emissions from intensive livestock farming (point sources) are clearly visible in the graphics.
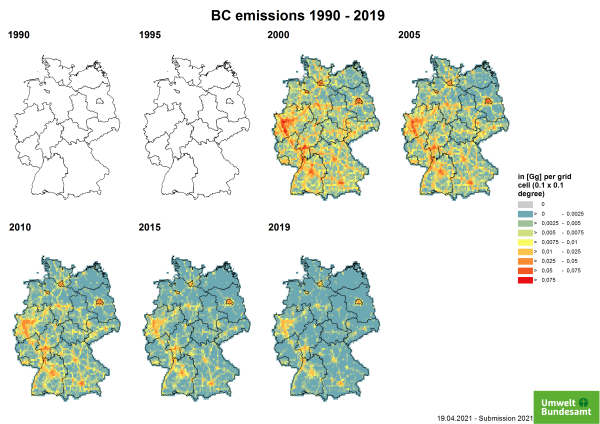
Particle and Fine Particle Emissions
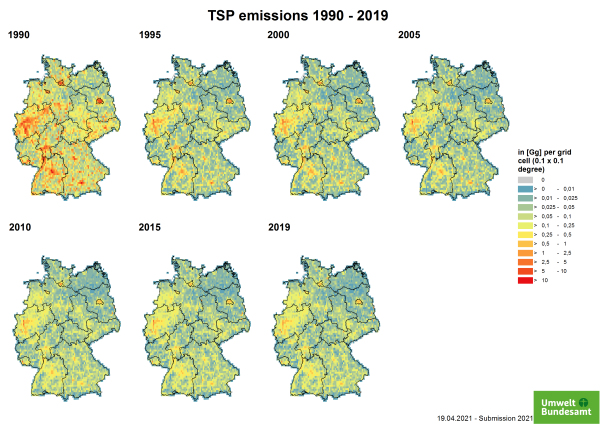
Corresponding to the SO2 emissions, total suspended particles (TSP) in general could be reduced by additional built-in filters in power plants as well as in vehicles.
With a decision of the Member States in 2006, PM10, PM2.5 and Black Carbon emissions for the years before 2000 are not mandatory in the reporting. In the 1990s, the sampling and analysis of particulate matter differed widely and a comparability was therefore not given. For this reason, the data was only scaled back to 1995.
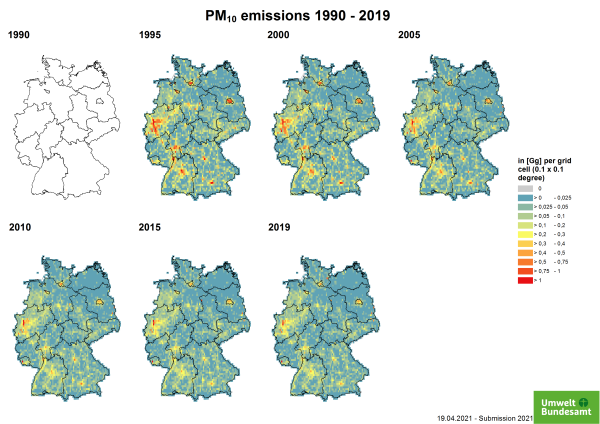
For PM2.5 and TSP, the point source emissions are calculated using the emission ratio between PM10 and TSP / PM2.5 sector by sector.
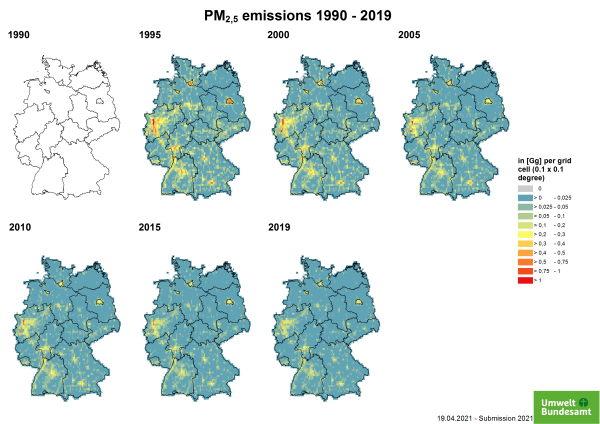
In addition to the other particle emissions, the black carbon emissions were also spatially distributed.
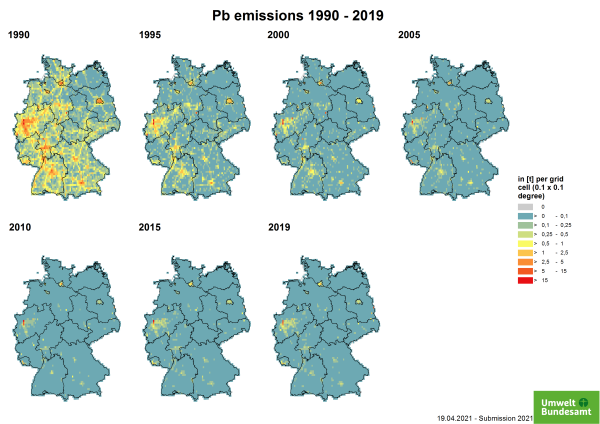
Emissions of Heavy Metals (HM)
Lead Emissions
Lead (Pb)-containing compounds are released in particular during combustion processes of coal and fuels. The main emitter here is the transport sector. Due to the toxic effect of these lead aerosols, leaded regular petrol (additive with lead tetraethyl) was banned in West Germany as early as 1988, the ban on leaded premium petrol followed in 1996. The European Union banned leaded petrol on 1 January 2000. Today, part of the Pb emissions still come from the automobile tyre and brake wear sector. This trend can be easily seen in the maps. The distribution parameter is analogous to road exhaust (NFR1A3bi - 1A3biv), the distribution parameter is vehicle mileage.
Another source of emissions is the metal processing industry - iron and steel. The distribution parameter is partially covered by the PRTR point sources; rest: by number of employees per district (metal production and processing).
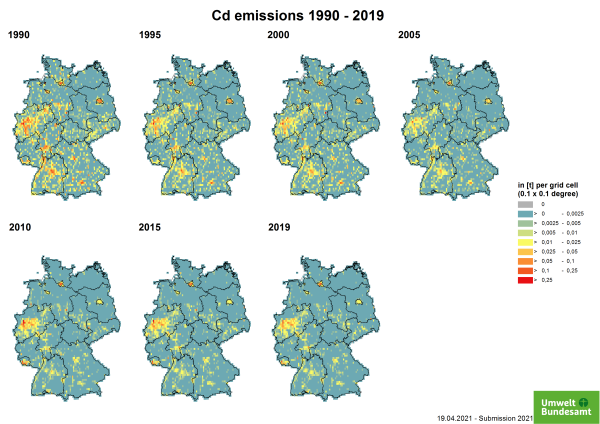
Cadmium Emissions
Cadmium (Cd) is one of the most toxic metals and substances for humans and the environment. The metal occurs in the body as a trace element and is incorporated through food. It is found in tobacco smoke, PVC and plastic and paint pigments. In the chemical industry, cadmium is a by-product of the extraction of zinc, lead or copper. The most important emission sources in Germany are the sectors of the metal processing industry - iron and steel, and copper production. It is also emitted by petroleum refineries and coal and oil combustion. For the latter, it can be captured via appropriate particle filters and thus reduced. For the dominant emission sources, the distribution is partially covered by PRTR point sources; the rest: by number of employees per district (metal production and processing).
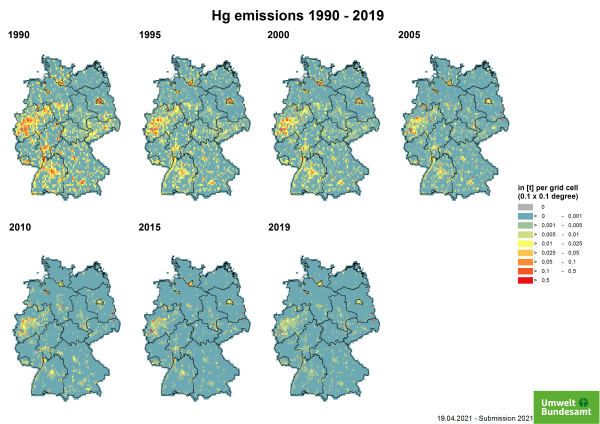
Mercury Emissions
Mercury (Hg) belongs to the group of heavy metals that occur both naturally (e.g. volcanic eruptions) and through industrial processes (e.g. mining, burning coal or heating oil) in the environment. A distinction is made between elemental (metallic) mercury (Hg0), inorganic mercury (iHg) and organic mercury compounds such as methylmercury (MeHg). It is mostly emitted bound to fine particles. It is mainly released during energy production from fossil fuels such as coal, oil and natural gas, and during metal-producing processes such as iron and steel production.The spatial distribution is made for energy supply via PRTR point sources (the rest: number of other power plants (<25 MW electric) for public supply per district).
Emissions of persistent organic pollutants (POP)
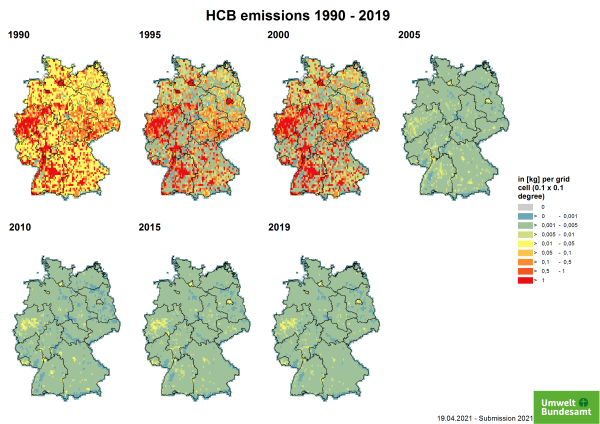
Data on POP emissions have a higher uncertainty compared to air pollutants such as SO2, CO or NOx. Therefore, the following maps should only be considered as estimates. It should be noted that the emission amounts are significantly different in magnitude from those of the air pollutants mentioned above.
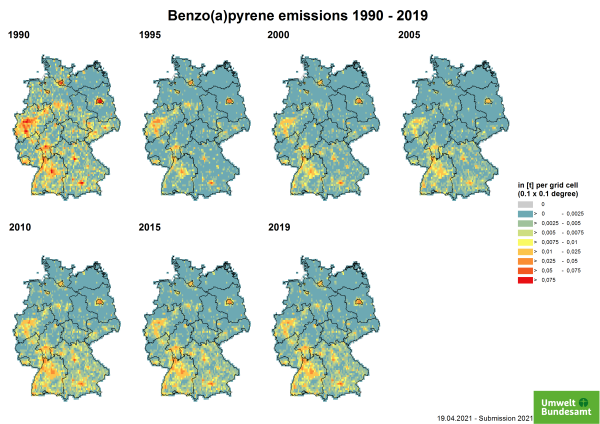
Polycyclic aromatic Hydrocarbons and Benzo(a)pyrene
PAHs are formed during the incomplete combustion of organic material (e.g. coal, heating oil, fuel, wood, tobacco, forest fires). The dominant sources of PAHs in the environment are thus from human activity: wood-burning and combustion of other biofuels. The dominating source is the residential sector - Stationary. The spatial distribution is therefore mainly covered by distribution according to energy carriers (national).

Benzoapyrene is considered an indicator substance of polycyclic aromatic hydrocarbons. For this reason, more measurement data and further information are available than for other POPs. In the determination of environmental pollution by this group of substances, benzo[a]pyrene is usually used as a reference.
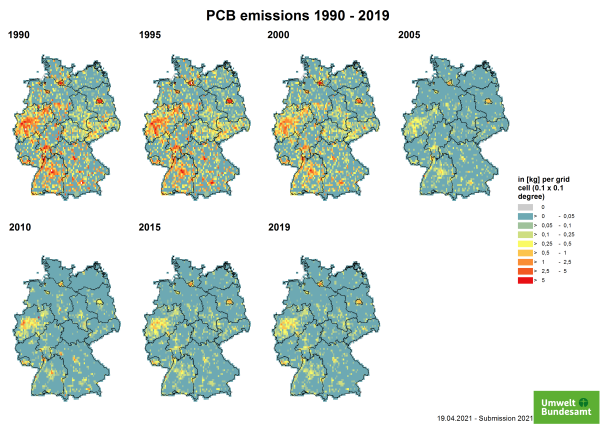
Polychlorinated biphenyls (PCB)
PCBs are classified as industrial chemicals and were used in various applications in pure form or as additives until the restrictions and bans came into force. Due to their properties (thermal stability, low water absorption and non-flammability), they were used in insulating oils in transformers, capacitors, additive to joint sealants and anti-corrosion coatings.The maps show the magnitude of HCB emissions in kilograms. The key sources are the sectors Public Power, Iron & Steel, and Residential - Stationary. The spatial distribution is therefore mainly covered by PRTR Point Sources (PS).
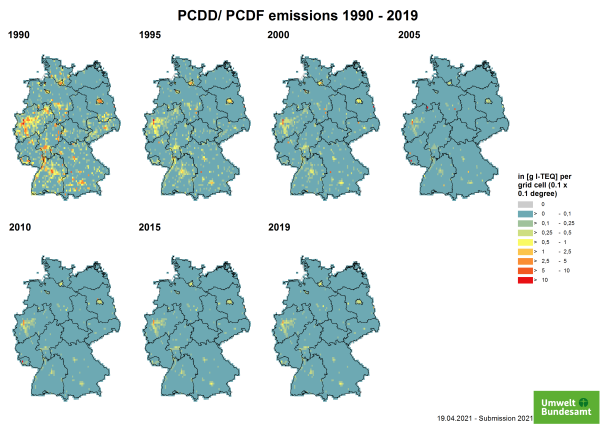
PCDD/PCDF
PCDD/PCDF emissions are formed as by-products in a variety of thermal processes, in the production of organochlorine chemicals, or in any oxidation reactions of hydrocarbon compounds in the presence of chlorine compounds. The magnitude of dioxins emissions is presented in the g I-TEQ range (toxic equivalence, TEQ) in the maps. The major key sources are the Residential - stationary combustion (1.A.4.b i), Other Waste: Building and Car Fires (5.E.2), and Metal Industrie - Iron and Steel (2C1). The spatial distribution is partially covered by information of PRTR point sources and for the residential sector according to energy carriers.
Hexachlorobenzene Emissions
Hexachlorobenzene (HCB) is a chemical substance that can also be formed as a by-product in the manufacture of chlorine compounds. It can also be released through incomplete combustion processes and leaching from landfills. The maps show the magnitude of HCB emissions in kilograms.
In the maps, the two main emission sources - production of secondary aluminium and application of pesticides in agriculture - as well as the emission trend are clearly visible. Degassing operations in refining plants of secondary aluminium production can produce HCB. The use of hexachloroethane has been prohibited by law in Germany since 2002, which eliminates the source of HCB. The emission distribution is partly covered by reports from the PRTR, the remaining emissions are calculated using number of employees per district in metal production and processing. More information is described under 2.C.3 - Aluminium Production.
In agriculture, HCB has not been used as a pure substance for a long time, as it has been banned since 1977. However, some pesticides that are still approved contain impurities that can arise during the manufacturing process. These agents are used to combat fungal infestations, particularly in cereal crops. Emissions from this sector are distributed over the agricultural area. However, this distribution is subject to great uncertainties, as the application is carried out depending on the mould infestation and the need for action. More information is described under 3.D.f - Agriculture other including use of pesticides.