meta data for this page
Explanation of Key Trends - Total Suspended Particulate Matter
Main drivers
Between 1990 and 2019 the total TSP emissions dropped by 81.5%, due to stricter regulations of the Old West Germany that applied to the New German Länder after the German Reunification and realized a change-over from solid to gaseous and liquid fuel, as well as advancements in filter technologies of combustion plants and industrial processes. The Main Drivers for TSP emissions are Fuel Combustion (NFR 1.A) with 61% of total 1990 emissions and a 93% reduction between 1990 and 2019 and as a sum the Industrial Processes (NFR 2) with 28% of the total 1990 emissions and a 62% reduction between 1990-2019.
TSP Emissions 1990-2019
| Total Emissions (kt) | Trend: latest compared to | ||||||||||||||
|---|---|---|---|---|---|---|---|---|---|---|---|---|---|---|---|
| 1990 | 1995 | 2000 | 2005 | 2010 | 2011 | 2012 | 2013 | 2014 | 2015 | 2016 | 2017 | 2018 | 2019 | 1990 | last years |
| 2,051 | 577 | 531 | 431 | 396 | 400 | 396 | 406 | 396 | 388 | 361 | 373 | 384 | 380 |  -81.5% -81.5% |  |
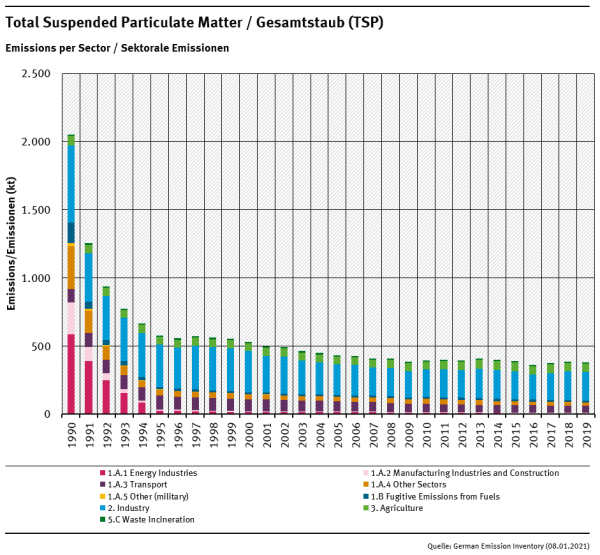
TSP trend by sector