meta data for this page
1.A.3.b i - Road transport: Passenger cars
Short description
In sub-category 1.A.3.b i - Road transport: Passenger cars emissions from fuel combustion in passenger cars (PCs) are reported.
| Category Code | Method | AD | EF | ||||||||||||
|---|---|---|---|---|---|---|---|---|---|---|---|---|---|---|---|
| 1.A.3.b i | T1, T3 | NS, M | CS, M, D | ||||||||||||
| Key Category | SO2 | NOx | NH3 | NMVOC | CO | TSP | PM10 | PM2.5 | BC | Pb | Hg | Cd | PCDD/F | PAH | HCB |
| 1.A.3.b i | -/- | L/T | -/- | L/T | L/T | -/- | L/T | L/T | L/T | L/T | -/- | -/- | L/- | -/- | - |
Methodology
Detailed information on the methods applied is provided in the superordinate chapter .
Activity data
Specific consumption data for passenger cars is generated within TREMOD 1).
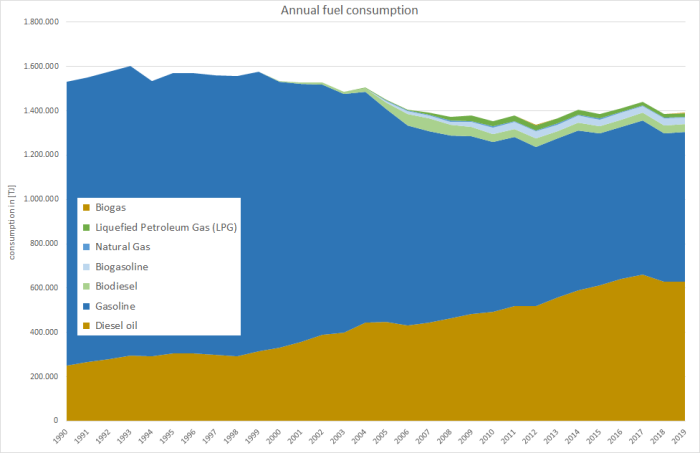
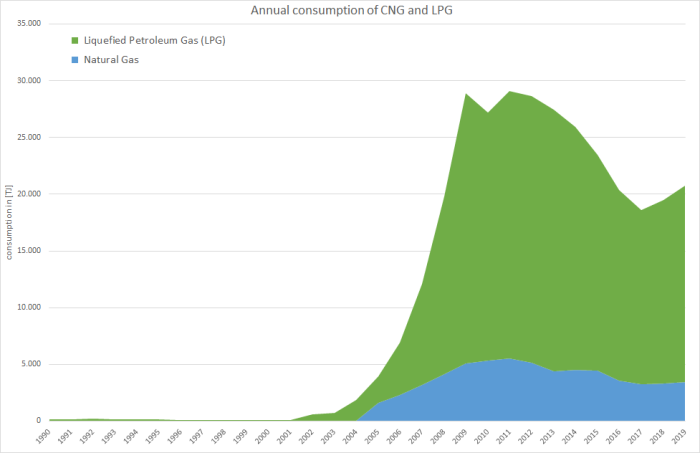
The following table gives an overview of annual amounts of the fuels consumed by passenger cars in Germany.
Table 1: Annual passenger car fuel consumption, in terajoule
| 1990 | 1995 | 2000 | 2005 | 2010 | 2011 | 2012 | 2013 | 2014 | 2015 | 2016 | 2017 | 2018 | 2019 | |
| Diesel oil | 251,081 | 304,573 | 330,544 | 447,843 | 491,684 | 517,460 | 518,642 | 556,149 | 589,801 | 612,084 | 641,130 | 661,289 | 629,483 | 628,079 |
|---|---|---|---|---|---|---|---|---|---|---|---|---|---|---|
| Gasoline | 1,280,592 | 1,263,563 | 1,198,941 | 960,365 | 766,348 | 763,397 | 719,091 | 718,322 | 721,165 | 685,429 | 685,497 | 695,259 | 668,949 | 675,555 |
| LPG | 138 | 138 | 94 | 2,357 | 21,823 | 23,613 | 23,532 | 23,077 | 21,464 | 18,963 | 16,799 | 15,377 | 16,153 | 17,332 |
| CNG | 0 | 0 | 0 | 1,604 | 5,351 | 5,494 | 5,140 | 4,380 | 4,483 | 4,476 | 3,590 | 3,247 | 3,332 | 3,412 |
| Biodiesel | 0 | 475 | 3,662 | 29,928 | 37,696 | 36,105 | 36,603 | 32,982 | 36,244 | 33,481 | 33,989 | 35,303 | 36,591 | 35,762 |
| Biogasoline | 0 | 0 | 0 | 6,597 | 29,609 | 31,292 | 31,866 | 30,792 | 31,361 | 29,728 | 29,775 | 29,312 | 30,078 | 29,136 |
| Biogas | 0 | 0 | 0 | 0 | 0 | 0 | 734 | 867 | 1,130 | 755 | 844 | 1,009 | 897 | 1,561 |
| Ʃ 1.A.3.b i | 1,531,811 | 1,568,749 | 1,533,241 | 1,448,694 | 1,352,511 | 1,377,360 | 1,335,609 | 1,366,568 | 1,405,647 | 1,384,915 | 1,411,625 | 1,440,795 | 1,385,484 | 1,390,837 |
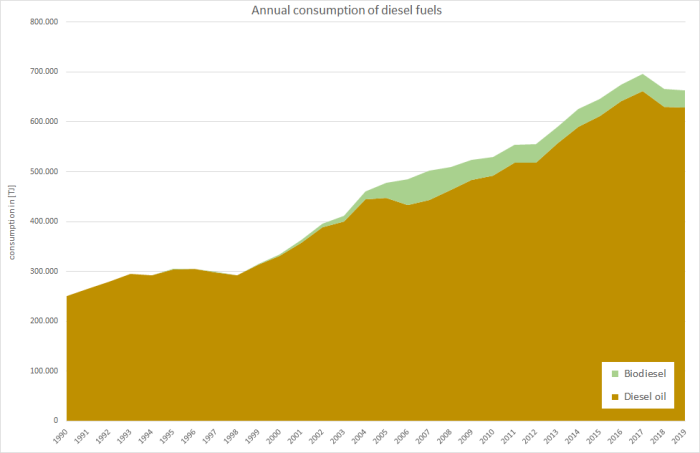
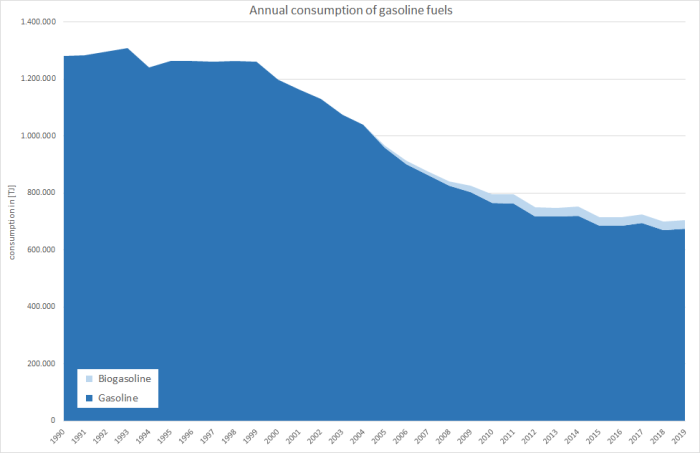
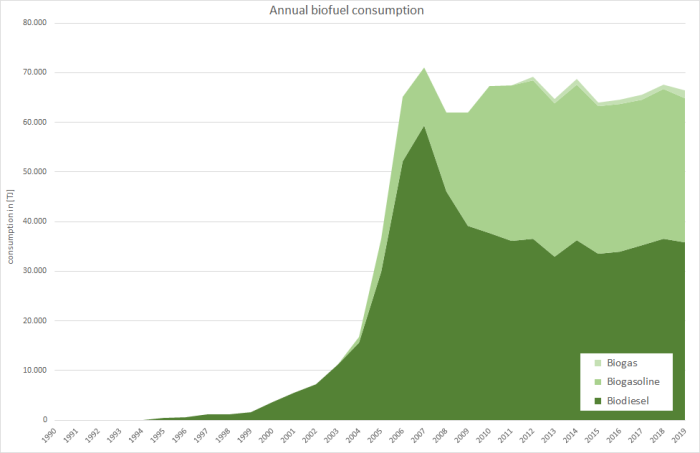
Here, the following charts underline the ongoing shift from gasoline to diesel-powered passenger cars, that started around 1999/2000.
For information on mileage, please refer to sub-chapters on emissions from tyre & brake wear and road abrasion.
Emission factors
The majority of emission factors for exhaust emissions from road transport are taken from the 'Handbook Emission Factors for Road Transport' (HBEFA, version 4.1) 2) where they are provided on a tier3 level mostly and processed within the TREMOD software used by the party 3).
However, it is not possible to present these highly specific tier3 values in a comprehendible way here.
With respect to the country-specific emission factors applied for particulate matter, given the circumstances during test-bench measurements, condensables are most likely included at least partly. 1)
For heavy-metal (other then lead from leaded gasoline) and PAH exhaust-emissions, default emission factors from (EMEP/EEA, 2019) 4) have been applied. Regarding PCDD/F, a tier1 EF from (Rentz et al., 2008) 5) is used.
Table 3: tier1 emission factors
| Pb | Cd | Hg | As | Cr | Cu | Ni | Se | Zn | B[a]P | B[b]F | B[k]F | I[1,2,3-c,d]p | PAH 1-4 | PCDD/F | |
| [g/TJ] | [mg/TJ] | [µg/km] | |||||||||||||
| Diesel oil | 0.012 | 0.001 | 0.123 | 0.002 | 0.198 | 0.133 | 0.005 | 0.002 | 0.419 | 498 | 521 | 275 | 493 | 1.788 | |
|---|---|---|---|---|---|---|---|---|---|---|---|---|---|---|---|
| Biodiesel1 | 0.013 | 0.001 | 0.142 | 0.003 | 0.228 | 0.153 | 0.005 | 0.003 | 0.483 | 575 | 601 | 317 | 569 | 2.062 | |
| Gasoline fuels | 0.037 | 0.005 | 0.200 | 0.007 | 0.145 | 0.103 | 0.053 | 0.005 | 0.758 | 96 | 140 | 69 | 158 | 464 | |
| CNG2 & biogas3 | NE | NE | NE | NE | NE | NE | NE | NE | NE | NE | NE | NE | NE | NE | |
| LPG4 | NE | NE | NE | NE | NE | NE | NE | NE | NE | 4.35 | 0.00 | 4.35 | 4.35 | 13.0 | |
| all fuels | 0.000006 | ||||||||||||||
1 values differ from EFs applied for fossil diesel oil to take into account the specific NCV of biodiesel
2 no specific default available from 6); value derived from CNG powered busses
3 no specific default available from 7); values available for CNG also applied for biogas
4 no specific default available from 8); value derived from LPG powered passenger cars
Discussion of emission trends
Table: Outcome of Key Category Analysis
| for: | NOx | NMVOC | CO | PM10 | PM2.5 | BC | Pb | PCDD/F |
|---|---|---|---|---|---|---|---|---|
| by: | Level & Trend | L/T | L/T | L/T | L/T | L/T | L/T | L/- |
Non-methane volatile organic compounds, nitrogen oxides, and carbon monoxide
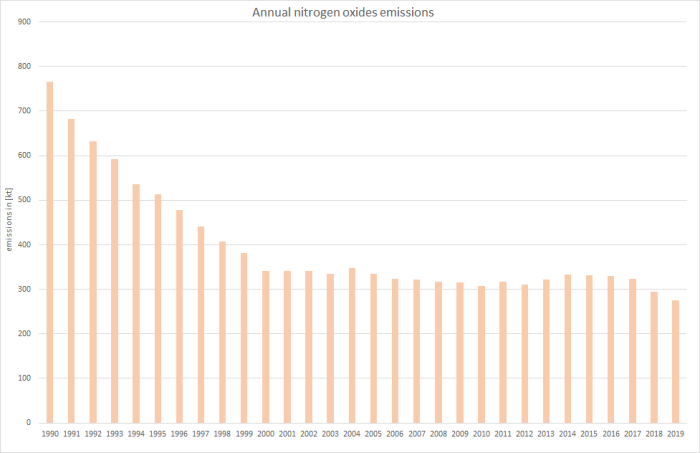
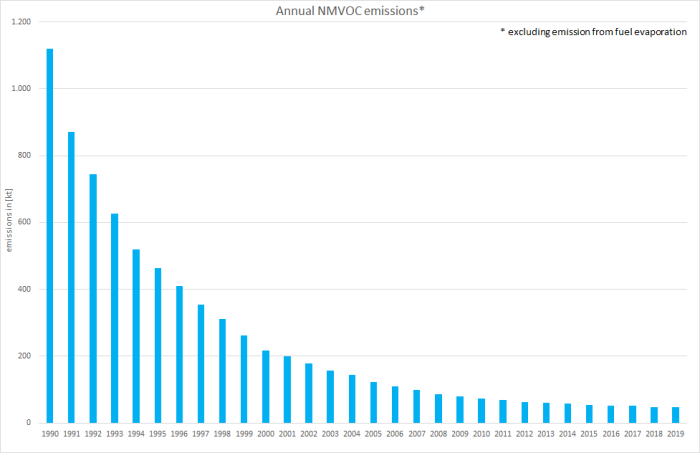
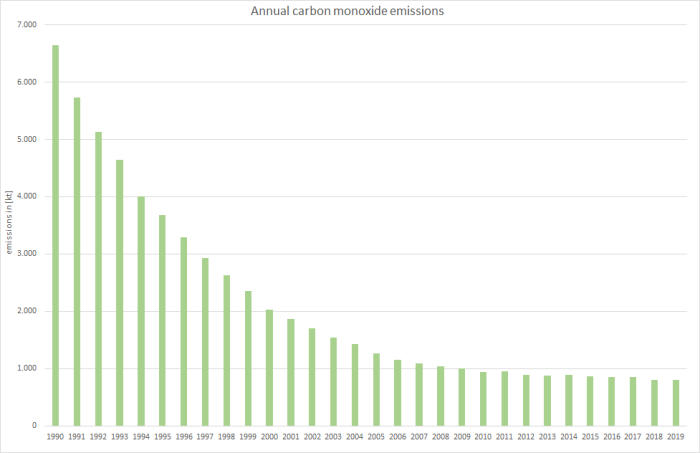
Since 1990, exhaust emissions of nitrogen oxides, NMVOC, and carbon monoxide have decreased sharply due to catalytic-converter use and engine improvements resulting from ongoing tightening of emissions laws and improved fuel quality.
Ammonia and sulphur dioxide
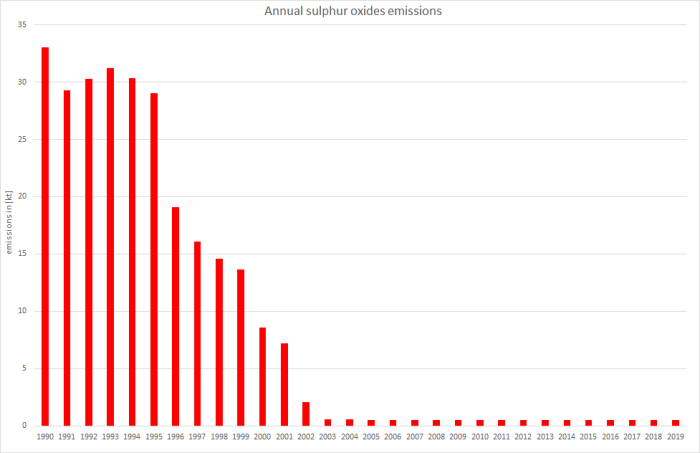
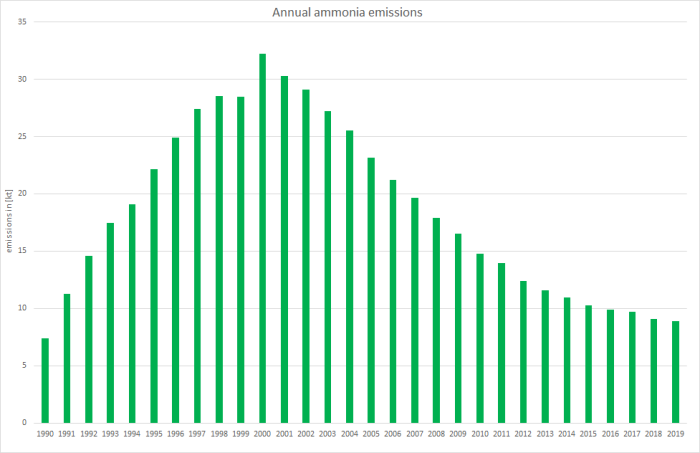
As for the entire road transport sector, the trends for sulphur dioxide and ammonia exhaust emissions from passenger cars show charcteristics very different from those shown above.
Here, the strong dependence on increasing fuel qualities (sulphur content) leads to an cascaded downward trend of emissions , influenced only slightly by increases in fuel consumption and mileage.
For ammonia emissions the increasing use of catalytic converters in gasoline driven cars in the 1990s lead to a steep increase whereas both the technical development of the converters and the ongoing shift from gasoline to diesel cars resulted in decreasing emissions in the following years.
Particulate matter & Black carbon
(from fuel combustion only; no wear/abrasion included)
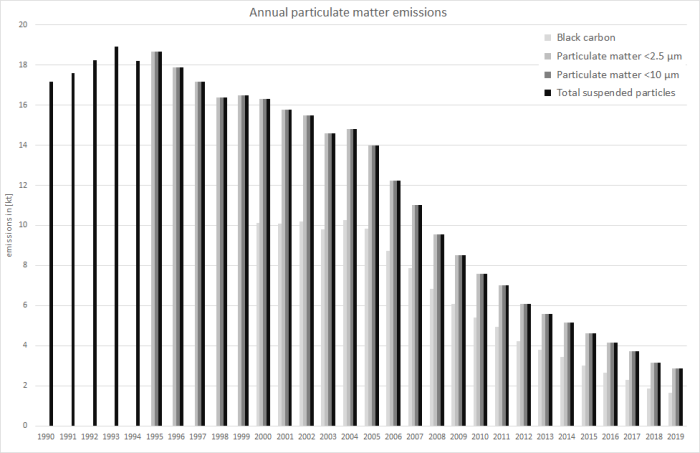
Starting in the middle of the 1990s, a so-called “diesel boom” began, leading to a switch from gasoline to diesel powered passenger cars. As the newly registered diesel cars had to meet the EURO2 standard (in force since 1996/'97) with a PM limit value less than half the EURO1 value, the growing diesel consumption was overcompensated qickly by the mitigation technologies implemented due to the new EURO norm. During the following years, new EURO norms came into force. With the still ongoing “diesel boom” those norms led to a stabilisation (EURO3, 2000/'01) of emissions and to another strong decrease of PM emissions (EURO4, 2005/'06), respectively. Over-all, the increased consumption of diesel in passenger cars was overastimated by the implemented mitigation technologies. The table below shows the evolution of the limit value for particle emissions from passenger cars with diesel engines.
With this submission, Black Carbon (BC) emissions are reported for the first time. Here, EF are estimated based on as fractions of PM as provided in 9). Due to this fuel-specific fractions, the trend of BC emissions reflects the ongoing shift from gasoline to diesel (“dieselisation”).
Table: EURO norms and their effect on limit values of PM emissions from diesel passenger cars
| exhaust emission standard (EURO norm) | Euro 1 | Euro 2 | Euro 3 | Euro 4 | Euro 5 | Euro 6 |
|---|---|---|---|---|---|---|
| in force for type approval since: | 1 Jul 1992 | 1 Jan 1996 | 1 Jan 2000 | 1 Jan 2005 | 1 Sep 2009 | 1 Sep 2014 |
| in force for initial registration since | 1 Jan 1993 | 1 Jan 1997 | 1 Jan 2001 | 1 Jan 2006 | 1 Jan 2011 | 1 Jan 2015 |
| resulting PM limit value in [mg/km] | 180 | 80/1001 | 50 | 25 | 5 | 5 |
1 for direct injection engines
Recalculations
Compared to submission 2020, recalculations were carried out due to a routine revision of the TREMOD software and the revision of several National Energy Balances (NEB).
Here, activity data were revised within TREMOD.
Table 4: Revised fuel consumption data, in terajoules
| 1990 | 1995 | 2000 | 2005 | 2006 | 2007 | 2008 | 2009 | 2010 | 2011 | 2012 | 2013 | 2014 | 2015 | 2016 | 2017 | 2018 | |
| DIESEL OIL | |||||||||||||||||
| Submission 2021 | 251.081 | 304.573 | 330.544 | 447.843 | 433.071 | 443.483 | 462.982 | 483.943 | 491.684 | 517.460 | 518.642 | 556.149 | 589.801 | 612.084 | 641.130 | 661.289 | 629.483 |
|---|---|---|---|---|---|---|---|---|---|---|---|---|---|---|---|---|---|
| Submission 2020 | 253.892 | 305.128 | 324.929 | 440.663 | 437.146 | 446.880 | 465.304 | 485.728 | 492.791 | 518.198 | 518.957 | 556.096 | 589.674 | 593.962 | 621.938 | 641.476 | 610.293 |
| absolute change | -2.811 | -555 | 5.615 | 7.180 | -4.075 | -3.397 | -2.322 | -1.785 | -1.107 | -738 | -315 | 53 | 127 | 18.122 | 19.192 | 19.813 | 19.190 |
| relative change | -1,11% | -0,2% | 1,73% | 1,63% | -0,93% | -0,76% | -0,50% | -0,37% | -0,22% | -0,14% | -0,06% | 0,01% | 0,02% | 3,05% | 3,09% | 3,09% | 3,14% |
| BIODIESEL | |||||||||||||||||
| Submission 2021 | 475 | 3.662 | 29.928 | 52.216 | 59.334 | 46.126 | 39.097 | 37.696 | 36.105 | 36.603 | 32.982 | 36.244 | 33.481 | 33.989 | 35.303 | 36.591 | |
| Submission 2020 | 476 | 3.600 | 29.343 | 52.587 | 59.599 | 46.163 | 38.936 | 37.500 | 35.842 | 36.337 | 32.710 | 35.928 | 32.198 | 32.732 | 34.022 | 35.226 | |
| absolute change | -0,87 | 62 | 585 | -371 | -265 | -37 | 160 | 196 | 262 | 267 | 272 | 316 | 1.283 | 1.258 | 1.281 | 1.365 | |
| relative change | -0,18% | 1,73% | 1,99% | -0,71% | -0,44% | -0,08% | 0,41% | 0,52% | 0,73% | 0,73% | 0,83% | 0,88% | 3,99% | 3,84% | 3,77% | 3,88% | |
| GASOLINE | |||||||||||||||||
| Submission 2021 | 1.280.592 | 1.263.563 | 1.198.941 | 960.365 | 900.551 | 863.738 | 826.374 | 802.616 | 766.348 | 763.397 | 719.091 | 718.322 | 721.165 | 685.429 | 685.497 | 695.259 | 668.949 |
| Submission 2020 | 1.275.916 | 1.260.078 | 1.196.370 | 958.621 | 899.359 | 862.416 | 825.308 | 801.658 | 765.478 | 762.566 | 718.328 | 717.580 | 720.676 | 684.853 | 684.954 | 694.769 | 668.337 |
| absolute change | 4.676 | 3.485 | 2.571 | 1.744 | 1.193 | 1.322 | 1.065 | 958 | 870 | 830 | 762 | 742 | 489 | 576 | 543 | 489 | 612 |
| relative change | 0,37% | 0,28% | 0,21% | 0,18% | 0,13% | 0,15% | 0,13% | 0,12% | 0,11% | 0,11% | 0,11% | 0,10% | 0,07% | 0,08% | 0,08% | 0,07% | 0,09% |
| BIOGASOLINE | |||||||||||||||||
| Submission 2021 | 6.597 | 12.981 | 11.666 | 15.800 | 22.931 | 29.609 | 31.292 | 31.866 | 30.792 | 31.361 | 29.728 | 29.775 | 29.312 | 30.078 | |||
| Submission 2020 | 6.585 | 12.964 | 11.648 | 15.779 | 22.904 | 29.575 | 31.257 | 31.833 | 30.760 | 31.340 | 29.703 | 29.752 | 29.291 | 30.051 | |||
| absolute change | 12,0 | 17,2 | 17,9 | 20,4 | 27,4 | 33,6 | 34,0 | 33,8 | 31,8 | 21,3 | 25,0 | 23,6 | 20,6 | 27,5 | |||
| relative change | 0,18% | 0,13% | 0,15% | 0,13% | 0,12% | 0,11% | 0,11% | 0,11% | 0,10% | 0,07% | 0,08% | 0,08% | 0,07% | 0,09% | |||
| CNG | |||||||||||||||||
| Submission 2021 | 1.604 | 2.280 | 3.174 | 4.146 | 5.062 | 5.351 | 5.494 | 5.140 | 4.380 | 4.483 | 4.476 | 3.590 | 3.247 | 3.332 | |||
| Submission 2020 | 1.608 | 2.286 | 3.182 | 4.155 | 5.072 | 5.361 | 5.505 | 5.151 | 4.389 | 4.519 | 4.492 | 3.603 | 3.257 | 3.980 | |||
| absolute change | -4,25 | -6,04 | -7,89 | -9,02 | -9,76 | -10,1 | -10,4 | -11,0 | -8,9 | -35,9 | -16,0 | -12,5 | -10,3 | -647 | |||
| relative change | -0,26% | -0,26% | -0,25% | -0,22% | -0,19% | -0,19% | -0,19% | -0,21% | -0,20% | -0,80% | -0,36% | -0,35% | -0,32% | -16,3% | |||
| BIOGAS | |||||||||||||||||
| Submission 2021 | 734 | 867 | 1.130 | 755 | 844 | 1.009 | 897 | ||||||||||
| Submission 2020 | 736 | 868 | 1.139 | 757 | 847 | 1.013 | 930 | ||||||||||
| absolute change | -1,58 | -1,76 | -9,06 | -2,70 | -2,95 | -3,20 | -33,6 | ||||||||||
| relative change | -0,21% | -0,20% | -0,80% | -0,36% | -0,35% | -0,32% | -3,61% | ||||||||||
| LPG | |||||||||||||||||
| Submission 2021 | 138 | 138 | 94,0 | 2.357 | 4.605 | 8.942 | 15.652 | 23.842 | 21.823 | 23.613 | 23.532 | 23.077 | 21.464 | 18.963 | 16.799 | 15.377 | 16.153 |
| Submission 2020 | 138 | 138 | 94,0 | 2.357 | 4.605 | 8.942 | 15.652 | 23.842 | 21.823 | 23.613 | 23.532 | 23.077 | 21.464 | 18.963 | 16.799 | 15.377 | 13.570 |
| absolute change | 0,00 | 0,00 | 0,00 | 0,00 | 0,00 | 0,00 | 0,00 | 0,00 | 0,00 | 0,00 | 0,00 | 0,00 | 0,00 | 0,00 | 0,00 | 0,00 | 2.583 |
| relative change | 0,00% | 0,00% | 0,00% | 0,00% | 0,00% | 0,00% | 0,00% | 0,00% | 0,00% | 0,00% | 0,00% | 0,00% | 0,00% | 0,00% | 0,00% | 0,0% | 19,0% |
| TOTAL FUEL CONSUMPTION | |||||||||||||||||
| Submission 2021 | 1.531.811 | 1.568.749 | 1.533.241 | 1.448.694 | 1.405.704 | 1.390.337 | 1.371.079 | 1.377.491 | 1.352.511 | 1.377.360 | 1.335.609 | 1.366.568 | 1.405.647 | 1.384.915 | 1.411.625 | 1.440.795 | 1.385.484 |
| Submission 2020 | 1.529.946 | 1.565.820 | 1.524.993 | 1.439.177 | 1.408.947 | 1.392.667 | 1.372.362 | 1.378.140 | 1.352.529 | 1.376.981 | 1.334.873 | 1.365.479 | 1.404.740 | 1.364.927 | 1.390.625 | 1.419.204 | 1.362.386 |
| absolute change | 1.865 | 2.929 | 8.248 | 9.516 | -3.242 | -2.330 | -1.282 | -649 | -18 | 379 | 736 | 1.089 | 908 | 19.988 | 21.000 | 21.591 | 23.098 |
| relative change | 0,12% | 0,19% | 0,54% | 0,66% | -0,23% | -0,17% | -0,09% | -0,05% | 0,00% | 0,03% | 0,06% | 0,08% | 0,06% | 1,46% | 1,51% | 1,52% | 1,70% |
Due to the variety of tier3 emission factors applied, it is not possible to display any changes in these data sets in a comprehendible way.
For more information on recalculated emission estimates reported for Base Year and 2018, please see the pollutant-specific recalculation tables following chapter 8.1 - Recalculations.
Planned improvements
Besides a routine revision of the underlying model, no specific improvements are planned.


