meta data for this page
This is an old revision of the document!
5.C.2 - Open Burning of Waste
| Category Code | Method | AD | EF | ||||||||||||
|---|---|---|---|---|---|---|---|---|---|---|---|---|---|---|---|
| 5.C.2 | CS | Q | D, CS | ||||||||||||
| Key Category | SO₂ | NOₓ | NH₃ | NMVOC | CO | BC | Pb | Hg | Cd | Diox | PAH | HCB | TSP | PM₁₀ | PM₂ ₅ |
| 5.C.2 | -/- | -/- | - | -/- | -/- | -/- | -/- | - | -/- | -/- | -/- | - | -/- | L/- | L/- |
Within NFR sub-category 5.C.2 - Open Burning of Waste, the German emissions inventory provides emissions from registered bonfires and other wooden materials burnt outdoors. Emissions from bonfires are key source for PM2.5 and PM10, but in principle of minor priority due to discontinuous appearance.
Please see chapter regarding farming/plantation waste: https://thg.thuenen.de/iir-de/sector/agriculture/field_burning/start - this is banned by law in Germany. So there is no gap of reporting.
Emissions from open burning of wood and green waste for traditional purposes, so-called bonfires such as Easter fires, are reported model-based. In addition to biogenic carbon dioxide, emissions of NOx, SO2, CO, NMVOC, particulate matter (PM2.5, PM10 and TSP) and Polycyclic Aromatic Hydrocarbons (PAHs) are covered so far.
Method
For developing of a estimation frame a survey regarding the number of such bonfires was carried out by an expert work 1). As the result, questionnaires from municipalities and statistical projections for Germany for the year 2016 were checked. The project has shown a declining trend since 1990. On the basis of expert judgement, a further reduction of emissions in the future is expected.
As discussed on Review 2020 regarding all relevant sources: A comparison shows that the volume of bonfires is significantly higher than the volume of campfires. In terms of number, however, the two types of fires are similar. Due to the large fluctuations of the minimum/maximum values, the median was proposed in study. In our view the estimation of bonfires emissions is conservative and completly.
Activity data
Activity data for this category are based on data from a step by step calculation: After the evaluation of the questionaires an extrapolation of the volume and the number of bonfires was made for Germany. The median values of clusters of city-sizes were used for the calculation, resulting in the following values 2):
| fire | resulting number | resulting quantity in kt of wooden wastes |
|---|---|---|
| easter fires et. | 54 | 343.3 |
| other open burning of wood | 49 | 59.3 |
Emission factors
As discussed on Review 2020 regarding EF used and referenced: We use different EF from different references instead the EF of Table 3-1 Tier 1 emission factors for source category 5.C.2 Small-scale waste burning, because the Tier 1 EF seem not suitable for the burning of wooden wastes. We consider both fresh wood (garden and park waste) and dry wood (without coatings etc.). We have tried to find relevant parallels, especially because of the burning of fresh wood with regard to forest fires.
Emission factors used were taken from different sources:
| pollutant | figure | reference |
|---|---|---|
| CO | 58.0 | GB 2016 small combustion Table 3-6: Tier 1 emission factors for NFR source category 1.A.4.b, using biomass |
| NOx | 0.9 | Research results from literature: wood burning as it was documented in Ireland's IIR |
| SO2 | 0.2 | Research results from literature: wood burning as it was documented in Ireland's IIR |
| NMVOC | 47.0 | GB 2016 Forest fires, table 3-1, according 'wood burned' |
| TSP | 17.0 | GB 2016 Forest fires, table 3-1, according 'wood burned' |
| PM10 | 11.0 | GB 2016 Forest fires, table 3-1, according 'wood burned' |
| PM2.5 | 9.0 | GB 2016 Forest fires, table 3-1, according 'wood burned' |
| BC | 0.81 | GB 2016 Forest fires, table 3-1, according 'wood burned' |
| PCDD/F | 10.0 µg/ t | GB 2016 Forest fires, table 3-2 |
| PAH | 0.00339 | sum of single compounts |
| BaP | 0.0013 | Research results for charcoal |
| BbF | 0.0015 | Research results for charcoal |
| BkF | 0.0005 | Research results for charcoal |
| IxP | 0.00009 | Research results for charcoal |
| Pb | 0.32 g/ t | GB 2016 Forest fires, table 3-2 3) |
| Cd | 0.13 g/ t | GB 2016 Forest fires, table 3-2 4) |
Trends in emissions
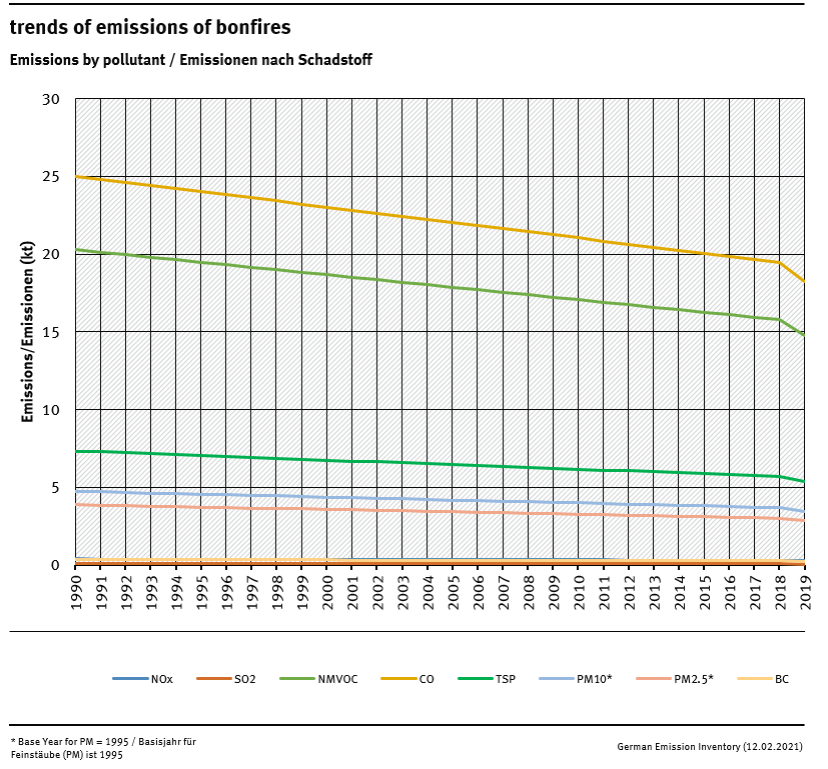
All trends in emissions correspond to trends of AD. No rising trends are to identify. In 2019, there were many bans on open fires due to increased forest fire danger.
Recalculations
With activity data and emission factors remaining unrevised, no recalculations have been carried out compared to last year's submission.
For pollutant-specific information on recalculated emission estimates for Base Year and 2018, please see the pollutant specific recalculation tables following chapter 8.1 - Recalculations.


