meta data for this page
1.A.1.a - Public Electricity And Heat Production
Short description
Source category 1.A.1.a - Public Electricity and Heat Production comprises district heating plants and electricity and heat production of power plants. Waste incineration is also included.
| Category Code | Method | AD | EF | ||||||||||||
|---|---|---|---|---|---|---|---|---|---|---|---|---|---|---|---|
| 1.A.1.a | T2 | NS | CS | ||||||||||||
| NOx | NMVOC | SO2 | NH3 | PM2.5 | PM10 | TSP | BC | CO | PB | Cd | Hg | Diox | PAH | HCB | |
| Key Category: | L/T | -/- | L/T | -/- | L/T | L/T | L/T | -/- | L/- | -/- | L/T | L/T | L/T | -/- | L/- |
Methodology
A method amounting to Tier 2 is used for emission reporting. This means the use of country-specific data at a more detailed level. Emission factors and activity data are available for different fuel types, different technologies, plant size, etc. The use of plant-specific data for a bottom-up approach is not possible. There are fuel data including NOx, SOx and TSP emissions for large combustion plants, but only measured and verified data were used.
Activity data
Conventional fuels
The key source of all conventional fuels is the National Energy Balance (NEB) 1). The fuel input for electricity production is given in line 11 (“Public thermal power stations”) of the National Energy Balance. The fuel inputs for public heat production are given in lines 15 (“combined heat and power stations”) and 16 (“district heating stations”). Line 14 (“Hydroelectric, wind-power, photovoltaic systems and other similar systems”) comprises all systems/ plants that generate electricity from biogas, landfill gas, sewage-treatment gas or solid biomass and feed the electricity into the public grid. Since no cut-off limit applies for such systems, this category includes very small systems too. German statistics provide only electricity generation data of those biomass plants, who feed into the public grid. But the Renewable Energy Act (EEG) does allow a full registration of electricity generation from renewable energies. However, the calculation of fuel data is connected with high uncertainties, since an average generation efficiency is necessary for the conversion.
Above-mentioned data provided by the NEB are summarised fuel consumption data. To get technical details which are needed for calculating emissions, additional statistical data are used.
All the data result in the calculation model “Balance of Emission Sources” which is part of the central database (CSE). The aim of this database is to produce more detailed fuel consumption data which are adjusted to the special technical characteristics of electricity and heat production. As a result, fuel-specific and technology-specific emission factors may be applied to the relevant activity rates. As a result, 142 so called time series were implemented in the database CSE. The year 1990 required a different structure within the database with 154 additional time series, since this was the year of the re-unification in Germany with two different statistical offices and two data systems.
When the calculations for submission 2022 were done, the Energy Balance 2020 was not yet available. Insofar, for the year 2020, preliminary data are used. These data are also provided by the Working Group on Energy Balances which compiles a preliminary energy balance. That's the reason why Germany has to done recalculations for the previous year.
For waste incineration plants, both energy and waste statistics are used to ensure completeness and to avoid double counting.
Biomass
The database for the calculation model consists of the National Energy Balance. Line 14 (“Hydroelectric, wind-power, photovoltaic systems and other similar systems”) comprises all systems/ plants that generate electricity from biogas, landfill gas, sewage-treatment gas or solid biomass and feed the electricity into the public grid. Since no cut-off limit applies for such systems, this category includes very small systems, too. German statistics provide only electricity generation data of those biomass plants, who feed into the public grid. But the Renewable Energy Act (EEG) does allow a full registration of electricity generation from renewable energies. However, the calculation of fuel data is connected with high uncertainties, since an average generation efficiency is necessary for the conversion.
Waste
Activity data from waste incineration plants are given by the waste statistics of the Federal Statistical Office (Statistisches Bundesamt, Fachserie 19, Reihe 1 2)).
Waste quantities are available at a very detailed level for different economic sectors. Municipal and industrial waste were classified in keeping with the Ordinance on the European Waste Catalogue (AVV), with industrial waste including all waste with waste-classification numbers beginning with the numbers 01 through 19.
Emission factors
Large and medium combustion plants
The underlying data for the emission factors used is provided by the report on the research project “Ermittlung und Evaluierung von Emissionsfaktoren für Feuerungsanlagen in Deutschland für die Jahre 1995, 2000 und 2010” (Determination and evaluation of emission factors for combustion systems in Germany for the years 1995, 2000 and 2010“; RENTZ et al, 2002) 3). The values for the intermediate years 1996-1999 and 2001-2008 are obtained via linear interpolation.
That project, along with the linear interpolation for the intermediate years, has also provided the underlying data for the source categories 1.A.1.b, 1.A.1.c and 1.A.2.f i, where the factors include power plants, gas turbines or boilers for production of steam and hot/ warm water. The research project was carried out by the Franco-German Institute for Environmental research (Deutsch-Französisches Institut für Umweltforschung - DFIU) at the University of Karlsruhe and was completed in late 2002. The project's aim was to determine and evaluate representative emission factors for the years 1995, 2000 and 2010 for the main air pollutants produced by combustion plants and gas turbine plants in Germany that are subject to licensing requirements. This process consists primarily of analysing and characterising the relevant emitter structures, and the pertinent emission factors, for the year 1995, and then of updating the data for the years 2000 and 2010. This procedure systematically determines emission factors for the substances SOx, NOx, CO, NMVOC, dust, and N2O. The process differentiates between 12 coal fuels, 4 liquid fuels, 7 gaseous fuels and firewood. In addition, the available data relative to emission factors of other substances are also compiled; these other substances include PAH, PCDD/F, As, and Cd for combustion systems subject to licensing requirements. As part of another research project, completed in February 2007, for updating the National Programme in the framework of directive 2001/81/EC on national emission ceilings for certain atmospheric pollutants (“NEC Directive”), individual emission factors for the components SO2, NOx and dust were revised in keeping with recent findings.
In 2018 and 2019 SO2, NOx, TSP, PM, CO, NH3 and Hg emission factors were revised for all large combustion plants. 4)) For the reporting year 2016 a complete data set is available. In former times data were not complete. There was no reporting obligation of co-incineration plants. The large combustion data base was also the data basis of the research project (Fichtner et al. 2011) 5) which was completed in 2011. Since the data set was not complete that time, in some cases a revision until 2004 was necessary. Heavy metal emission factors are mainly the result of a comprehensive study of PRTR data, which provide information about emissions and the quality (measurement/estimated/calculated data) of large combustion plants. The combination of emission from PRTR and the relevant fuel data, which contains additional data of large combustion plants (EU legislative), allows the determination of plant-specific emission factors. Due to the fact, that only some plants do really measure heavy metals, the determined emission factors were used for the whole sector (1.A.1.a). HCB emission factors of hard coal were taken from the EMEP EEA Guidebook 2009. Black carbon emission factors for all fuels are given by the EMEP EEA Guidebook 2019.
Regarding natural gas and light fuel oil SO2 emission factors were calculated by using data on the sulfur content. In terms of natural gas sulfur content has been measured during a project. Data on all important regions is available. The sulfur of the odorization is also considered, which is a bit conservativ, since not all plants use natural gas with odorization. Concerning light fuel oil, the limit value is used for emission reporting. It can be assumed that large combustion plants mainly use light fuel oil with a sulfur content of 1000 mg/kg while low-sulfur fuel oil is mainly used in small combustion plants.
Engines
Emission factors for gas engines were determined by the project: “Processing of data in emissions declarations pursuant to the 11th Ordinance on the Execution of the Federal Immission Control Act”. Additional data were provided by the local authorities (results of emission monitoring). All emission factors used for reporting are derived from plants which are subject of licensing and reviewed by the competent authorities. However, a large number of the 7,500 biogas plants in Germany does not require a license. Due to the small size of the plants the total fuel consumption of small biogas plants is lower than fuel consumption of those plants who need a permit. Since emission behaviour of small and medium sized plants is completely different, it's necessary to use specific emission factors for each plant type. The calculation of activity data of small and medium sized plants is based on data from the Federal Network Agency. Emission factors are a result of different regional measurement compaigns in Saxony and Bavaria and the project: “Analysis of the emissions from biogas plants, and quantification of material flows through such plants, for ecological assessment of agricultural-sector biogas production and for inventories of the German agricultural sector” (DBFZ 2014). Emission factors for liquid fuels are given by the project: “Determination of the state-of-the-art of emission control techniques for stationary internal combustion engines”, carried out by (Müller-BBM, 2010).
Waste incineration plants
Data source for emission factors of waste incineration plants is the project: “Review of the emission factors for waste incineration”, carried out by (ATZ 2010) 6). The aim of the study was to determine emission factors for municipal waste, industrial waste, hazardous waste, waste wood and sewage sludge incineration. Emission factors for 25 pollutants are available. The different fuel categories are consistent with the waste statistic. The fuel category “industrial waste” has different meanings: substitute fuel originate from municipal or industrial waste or untreated production waste. This kind of fuels were basically incinerated in so called waste-to-energy-plants (in German EBS-Kraftwerke). Compared to conventional municipal waste incineration plants, “EBS-Kraftwerke” are mostly smaller and more efficient. There are also some technical differences. All these plants have to comply with the same limit values. Nevertheless emission factors are different due to different abatement technology and operating conditions. HCB emission factors of municipal waste are derived from a measurement project initiated by the industrial association. The 1990 value for waste incineration plants is an expert judgement derived from the development of legislative regulation. Furthermore it was necessary to develop a method to calculate emissions from co-incineration systems. In Germany there is a large number of coal fired power plants, which also use a relevant amount of different waste fuels like sewage sludge, industrial waste (for example from paper industry), conditioned municipal waste etc. Since plant-specific data cannot be used, it's necessary to calculate emissions at a more aggregated level. Fuel data are available from ETS. Furthermore the information about the coal qualities is available. Therefore it's possible to calculate specific emission factors for co-incinerated waste fuels.
Table 1: Implied emission factors for public electricity and heat production
| SOx | NOx | TSP | CO | Pb | Hg | Cd | |
|---|---|---|---|---|---|---|---|
| [kg/TJ] | [g/TJ] | ||||||
| Hard Coal | 38.8 | 56.2 | 1.5 | 6.4 | 3.66 | 1.03 | 0.50 |
| Lignite | 56.1 | 77.8 | 2.0 | 32.3 | 2.76 | 2.89 | 0.37 |
| Natural gas | 0.1 | 37.0 | 0.3 | 10.4 | NA | 0.01 | NA |
| Petroleum products | 65.3 | 97.1 | 3.7 | 26.7 | 2.75 | 0.52 | 0.10 |
| Biomass (excluding Waste) | 54.9 | 172.2 | 4.4 | 139.9 | 4.54 | 0.14 | 0.10 |
| Municipal Waste | 3.2 | 49 | 0.6 | 5.0 | 2.70 | 1.10 | 0.36 |
The table gives an overview of the implied emission factors. In reality, the German inventory compiling process is very complex and includes the use of a considerable number of emission factors, which cannot be published completely in the IIR. There are different emission factors available for diverse fuel types, various techniques and licensing requirements. However, the implied emission factor may give an impression about the order of magnitude. PM10 and PM2.5 emission factors are calculated as a fraction of TSP. Regarding all solid fuels the share of PM10 is 90 % and the share of PM2.5 is 80 %. This is a simple but also conservative approach, knowing that, in reality, PM emissions depend on fuel, combustion and abatement technologies. In terms of natural gas and biogas PM10 and PM2.5 fractions are considered as 100 % of TSP. Regarding wood a share of 100% PM10 and 90% PM2.5 is used. For liquid fuels the default share of 100% PM10 and PM2.5 is used. In the cases of co-incineration, where liquid fuels are only used for ignition in coal fired plants, the share of coal fired plants is used. PM emission reporting starts in 1995, since no sufficient information about the dust composition of the early 1990s is available.
Trend discussion for Key Sources
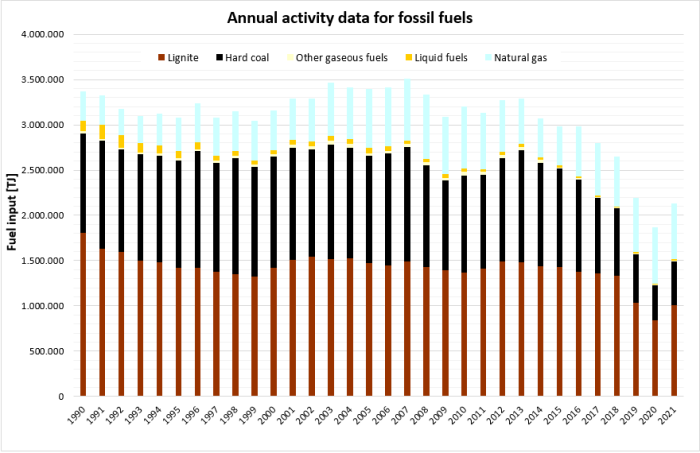
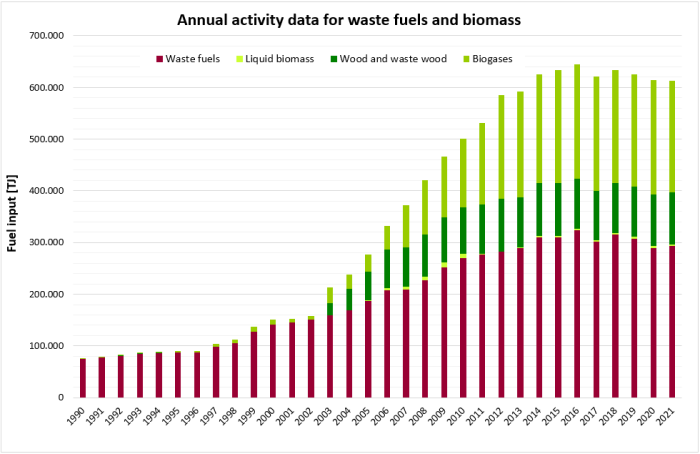
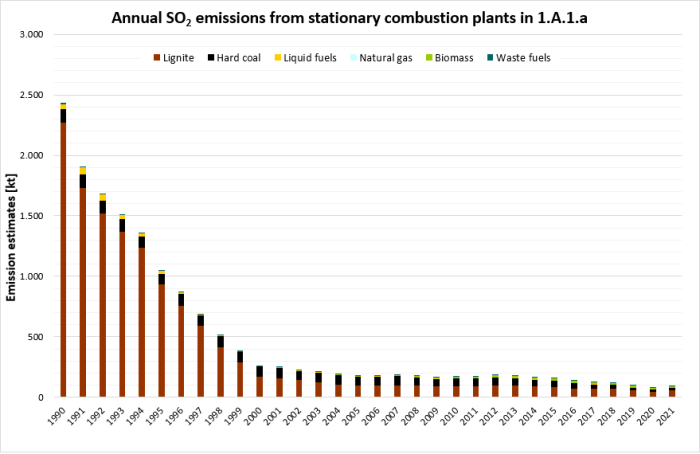
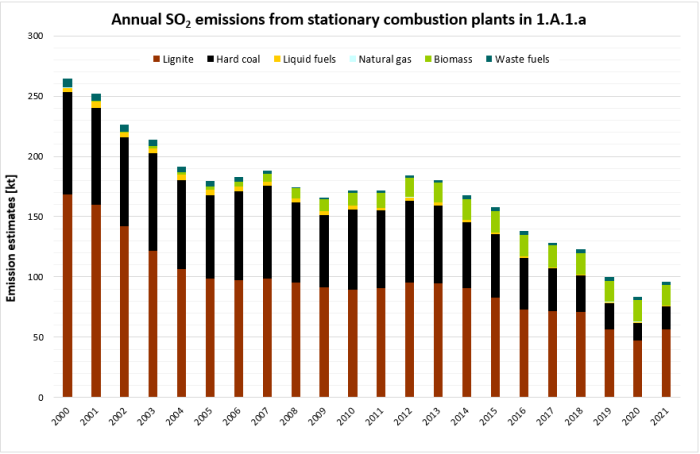
The following diagrams give an overview and assistance for explaining dominant emission trends of selected pollutants.
Fuel Consumption
The first graph shows that the total energy consumption of fossil fuels for public electricity and heat consumption didn't change very much since 1990. The main reasons are the rising electricity demand and a great number of industrial power plants whose emissions are now reported in source category 1.A.1.a. From 1990 to the present time, a slight fuel switch from coal to natural gas was observed. In 2009 fuel consumption of all fossil fuels decreased remarkably as a result of the economic crisis. The economic recovery in 2010 led to an increasing fuel consumption because of the increasing electricity demand. From 2003 biomass consumption rises considerably due to the legislative aid of renewable energies.
Sulfur Oxides - SOx
SOx emission trend shows the big dominance of lignite due to high Sulphur content of lignite fuels. However SOx emissions decrease more than lignite consumption does. Before the German Reunification in 1990, lignite fired public power plants in Eastern Germany didn't use flue gas desulphurisation plants. The implementation of stricter regulations in the New German Länder resulted in considerably decreasing emissions. In recent years the development of SO2 emissions is mainly influenced by coal consumption. From 2005 onwards biogas which has a considerable sulphur content is gaining in importance. In 2016 emissions from coal fired plants decreased considerably due to a stricter regulation related to the limit values and the reduction efficiency of desulfurization plants. The emission reduction in 2019 and 2020 is a result of the decreasing coal consumption.
Nitrogen Oxides - NOx
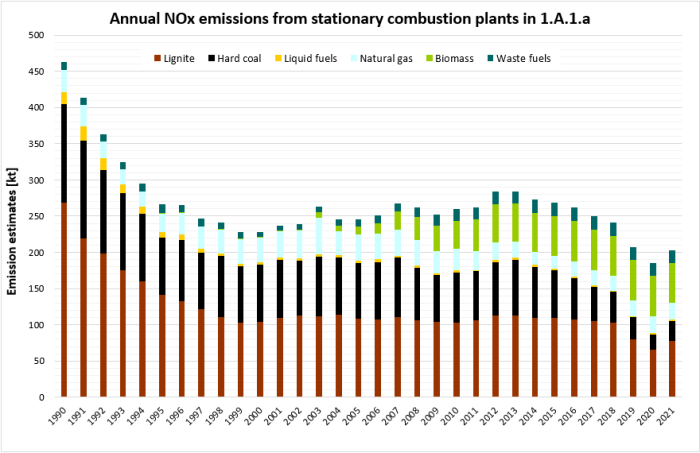
Nitrogen oxides emissions decreases due to declining lignite consumption in the early 1990s and due to NOx emission reduction measurements in the New German Länder. After 2002 the increasing consumption of natural gas biogas, wood and other biomass in the public sector gain influence and increases NOx emissions. The upward trend was only interrupted by the economic crises in 2009. From 2014 onwards NOx emissions decreases mainly caused by the decreasing hard coal consumption.
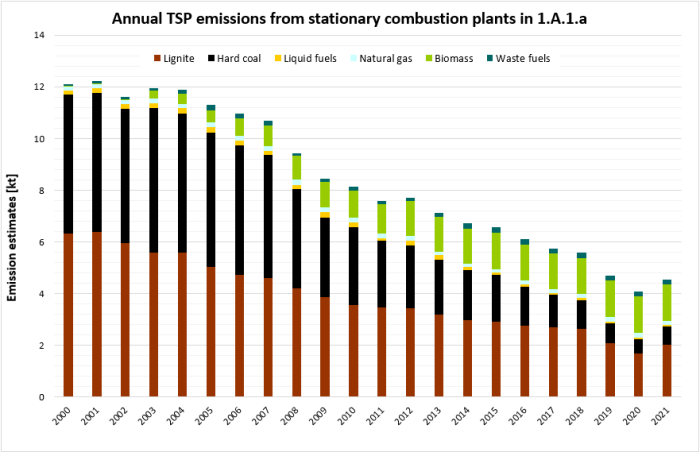
Particulate Matter - PM2.5 & PM10 & TSP
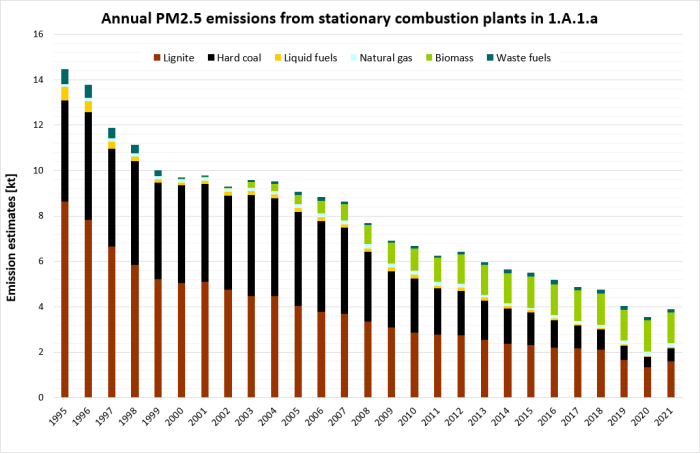
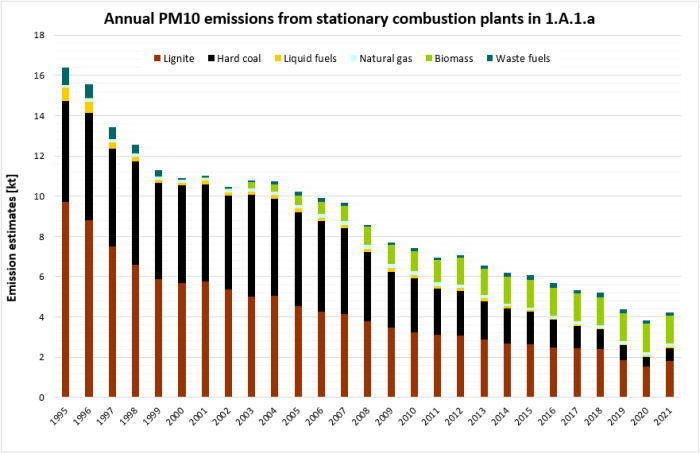
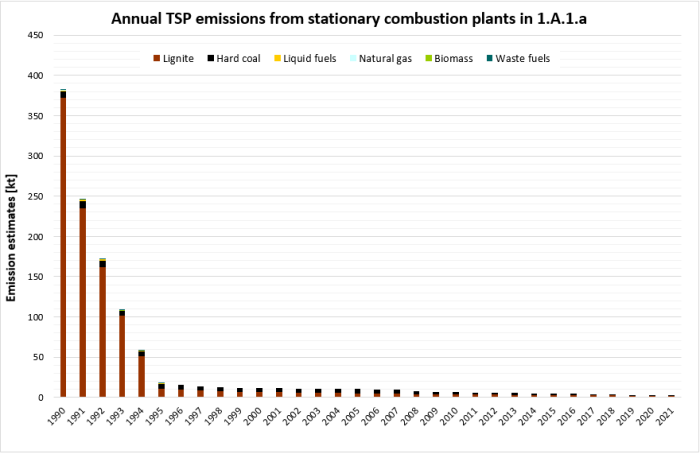
Similar to SOx emissions, Particulate Matter emissions decreases considerably since 1990 due to stricter regulations in eastern Germany. After 2002 PM10 and PM2.5 emission trends were influenced by the increasing use of biomass for public electricity and heat production. TSP and PM emissions from coal fired plants show a decreasing trend from 2005 onwards due to improvements of abatement systems. The remarkable Emission reduction in 2019 and 2020 is a result of the deacreasing coal consumption.
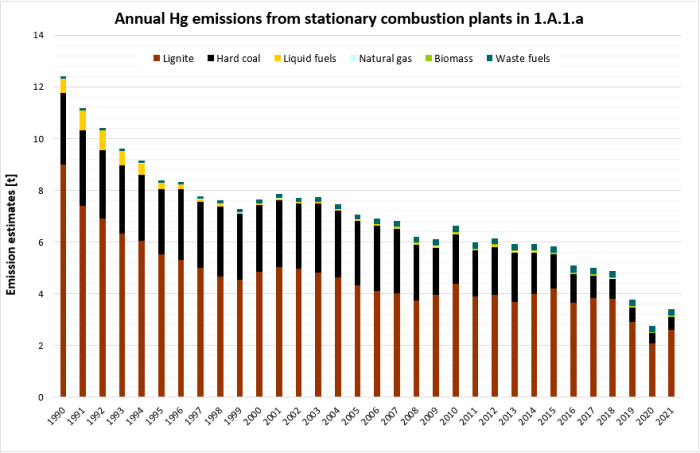
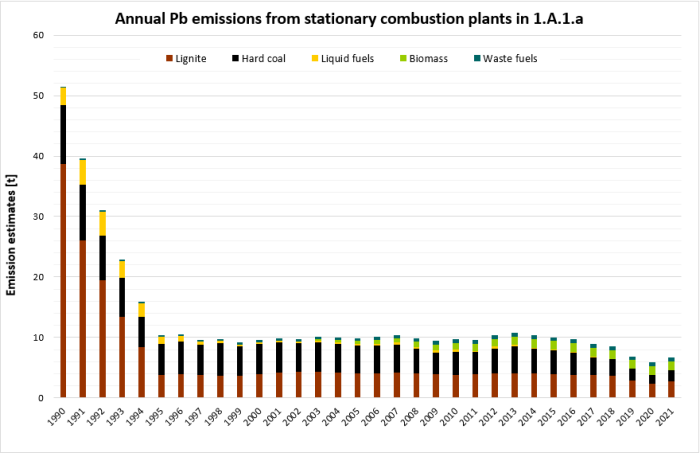
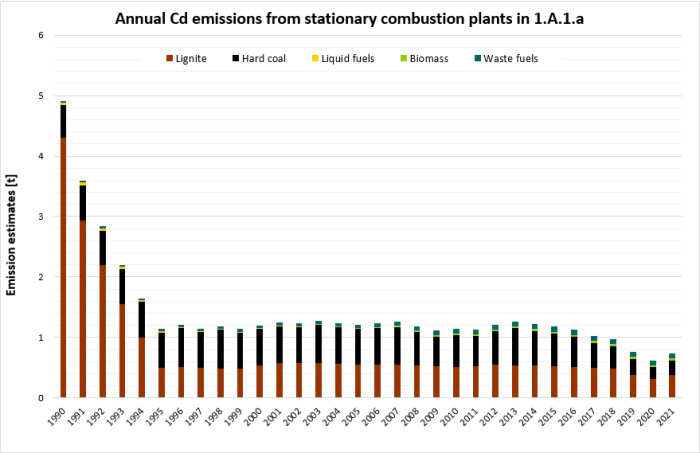
Priority Heavy metal - Hg, Pb & Cd
Emission trends of all priority heavy metals are mostly influenced by the emissions from lignite use. The reasons of the declining emissions are on the one hand the decreasing lignite consumption and on the other hand the implementation of stricter regulations in eastern Germany. Due to the fact, that heavy metal emission factors for waste incineration plants are constant, emission trends solely depend on coal consumption. In reality emission trends of all heavy metals would be more influenced by the emissions from waste fuels, since the emission factors for waste incineration plants in 1990 are expected to be high. In recent years emissions from Biomass combustion gain more and more influence on the trend.
Persistent Organic Pollutants
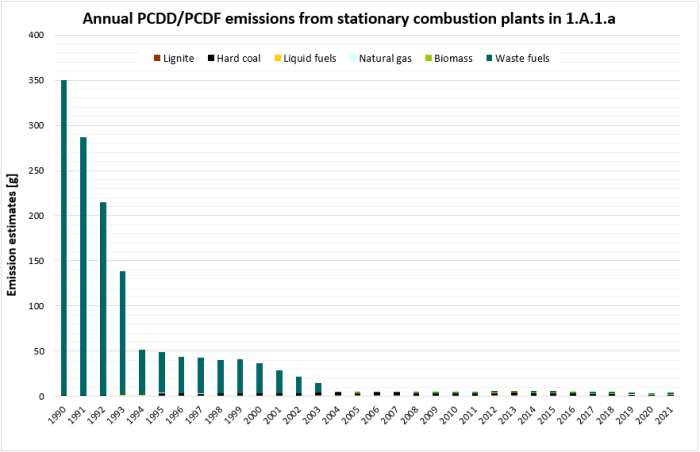
Main driver of the dioxin emission trend is by far waste incineration with high specific emissions in the early 90s and considerably decreasing emissions due to stricter regulations in Germany. In recent years emissions remain stable at a very low level.
Recalculations
Recalculations were necessary for 2020 due to the implementation of the now finalised National Energy Balance.
For pollutant-specific information on recalculated emission estimates for Base Year and 2020, please see the recalculation tables following chapter 8.1 - Recalculations.
Planned improvements
There is a running project on POPs and heavy-metal measurements for large combustion plants in order to get a better understanding of these “exotic” pollutants. At the moment, there are only a few measurement data available which show a wide range. Therefore, more frequent measurements are necessary.
New POPs emission factors are available for waste incineration plants for 2015. Before the implementation of these values, a trend discussion with the experts is necessary. The new PCB emission factors cannot be used at the moment since it would destroy the current inventory structure. Key source analyses wouldn't make sense any more. The new PCB emission factors are measured according to the WHO TEQ. The values which are currently used in the inventory are based on measurements according to German standards (Ballschmiter, LAGA) with a factor of 100,000 between both EF sources. The implementation of the new PCB emission factors will only be possible when new PCB emission factors are available for iron and steel production and cement industry.


