meta data for this page
1.A.2.g vii - Mobile Combustion in Manufacturing Industries and Construction
Short description
Under NFR 1.A.2.g vii - Mobile Combustion in Manufacturing Industries and Construction, emissions from Off-Road Construction Vehicles and Construction Machinery are reported in the German inventory.
| Category Code | Method | AD | EF | ||||||||||||
|---|---|---|---|---|---|---|---|---|---|---|---|---|---|---|---|
| 1.A.2.g vii | T1,T2 | NS, M | CS, D, M | ||||||||||||
| NOx | NMVOC | SO2 | NH3 | PM2.5 | PM10 | TSP | BC | CO | Pb | Cd | Hg | Diox | PAH | HCB | |
| Key Category: | -/T | -/- | -/- | -/- | L/T | -/T | -/- | L/- | L/- | -/- | -/- | -/- | -/- | -/- | - |
Methodology
Activity data
Sector-specific consumption data is included in the primary fuel-delivery data are available from NEB line 67: 'Commercial, trade, services and other consumers' (AGEB, 2022) 1)
Table 1: Sources for primary fuel-delivery data
| through 1994 | AGEB - National Energy Balance, line 79: 'Haushalte und Kleinverbraucher insgesamt' |
| as of 1995 | AGEB - National Energy Balance, line 67: 'Gewerbe, Handel, Dienstleistungen u. übrige Verbraucher' |
Following the deduction of energy inputs for military vehicles as provided in (BAFA, 2022) 2), the remaining amounts of gasoline and diesel oil are apportioned onto off-road construction vehicles (NFR 1.A.2.g vii) and off-road vehicles in commercial/institutional use (1.A.4. ii) as well as agriculture and forestry (NFR 1.A.4.c ii) based upon annual shares derived from TREMOD-MM (Knörr et al. (2022b)) 3) (cf. NFR 1.A.4 - mobile).
Table 2: Percental annual contribution of 1.A.2.g vii to fuel-specific over-all delivery data provided in NEB line 67
| 1990 | 1995 | 2000 | 2005 | 2010 | 2011 | 2012 | 2013 | 2014 | 2015 | 2016 | 2017 | 2018 | 2019 | 2020 | 2021 | |
|---|---|---|---|---|---|---|---|---|---|---|---|---|---|---|---|---|
| Diesel Fuels | 43.0% | 46.4% | 47.1% | 43.8% | 43.2% | 43.5% | 43.8% | 43.3% | 43.6% | 43.2% | 43.1% | 43.0% | 42.6% | 42.5% | 42.2% | 41.9% |
| Gasoline Fuels | 31.5% | 59.7% | 55.1% | 58.6% | 64.5% | 64.4% | 66.9% | 67.1% | 66.9% | 66.7% | 68.4% | 68.1% | 64.2% | 63.2% | 59.7% | 59.2% |
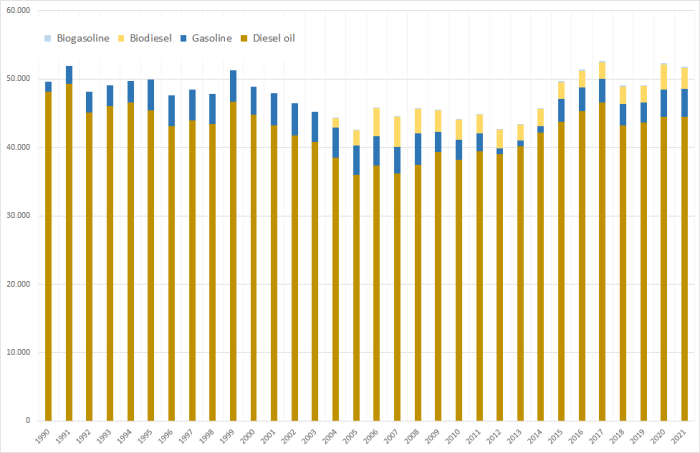
Table 3: Annual fuel consumption in construction vehicles and mobile machinery, in terajoules
| 1990 | 1995 | 2000 | 2005 | 2010 | 2011 | 2012 | 2013 | 2014 | 2015 | 2016 | 2017 | 2018 | 2019 | 2020 | 2021 | |
|---|---|---|---|---|---|---|---|---|---|---|---|---|---|---|---|---|
| Diesel Oil | 48.161 | 45.414 | 44.743 | 35.942 | 38.221 | 39.458 | 38.996 | 40.144 | 42.185 | 43.753 | 45.351 | 46.567 | 43.154 | 43.577 | 44.476 | 44.510 |
| Gasoline | 1.420 | 4.453 | 4.079 | 4.284 | 2.845 | 2.584 | 837 | 826 | 874 | 3.364 | 3.441 | 3.421 | 3.220 | 2.937 | 3.961 | 4.009 |
| Biodiesel | 0 | 0 | 0 | 2.297 | 2.930 | 2.753 | 2.752 | 2.381 | 2.592 | 2.393 | 2.404 | 2.486 | 2.509 | 2.482 | 3.694 | 3.092 |
| Biogasoline | 0 | 0 | 0 | 29.4 | 110 | 106 | 37.1 | 35.4 | 38.0 | 146 | 149 | 144 | 145 | 127 | 181 | 191 |
| Ʃ 1.A.2.g vii | 49.581 | 49.868 | 48.822 | 42.552 | 44.105 | 44.901 | 42.623 | 43.386 | 45.689 | 49.656 | 51.346 | 52.618 | 49.028 | 49.123 | 52.312 | 51.802 |
> NOTE: The remarkable increase in gasoline consumption after 2014 relates to the strongly increased inland deliveries reported in NEB line 67.
Emission factors
The emission factors used here are of rather different quality: Basically, for all main pollutants, carbon monoxide and particulate matter, annual IEF modelled within TREMOD MM (Knörr et al. (2022b)) 4) are used, representing the sector's vehicle-fleet composition, the development of mitigation technologies and the effect of fuel-quality legislation.
Table 4: Annual country-specific emission factors1, in kg/TJ
| 1990 | 1995 | 2000 | 2005 | 2010 | 2011 | 2012 | 2013 | 2014 | 2015 | 2016 | 2017 | 2018 | 2019 | 2020 | 2021 | |
|---|---|---|---|---|---|---|---|---|---|---|---|---|---|---|---|---|
| Gasoline fuels | ||||||||||||||||
| NH3 | 0.089 | 0.092 | 0.093 | 0.094 | 0.094 | 0.094 | 0.094 | 0.094 | 0.094 | 0.094 | 0.094 | 0.094 | 0.094 | 0.094 | 0.094 | 0.094 |
| NMVOC2 | 77.8 | 74.8 | 82.3 | 100.8 | 105.8 | 105.8 | 105.8 | 105.8 | 105.8 | 105.8 | 105.8 | 105.8 | 105.8 | 105.8 | 105.8 | 105.8 |
| NMVOC3 | 678 | 623 | 571 | 562 | 561 | 561 | 561 | 561 | 561 | 561 | 561 | 561 | 561 | 559 | 550 | 538 |
| NOx | 54.1 | 68.3 | 75.9 | 76.8 | 76.9 | 76.9 | 76.9 | 76.9 | 76.9 | 76.9 | 76.9 | 76.9 | 76.9 | 75.1 | 70.4 | 64.9 |
| SOx | 10.1 | 8.27 | 3.22 | 0.37 | 0.37 | 0.37 | 0.37 | 0.37 | 0.37 | 0.37 | 0.37 | 0.37 | 0.37 | 0.37 | 0.37 | 0.37 |
| BC5 | 0.30 | 0.27 | 0.24 | 0.24 | 0.24 | 0.24 | 0.24 | 0.24 | 0.24 | 0.24 | 0.24 | 0.24 | 0.24 | 0.24 | 0.24 | 0.24 |
| PM4 | 6.03 | 5.43 | 4.82 | 4.72 | 4.71 | 4.71 | 4.71 | 4.71 | 4.71 | 4.71 | 4.71 | 4.71 | 4.71 | 4.71 | 4.71 | 4.71 |
| TSP6 | 2.35 | 0.82 | leaded gasoline out of use since 1997 | |||||||||||||
| CO | 38,510 | 35,310 | 32,415 | 32,095 | 34,666 | 35,236 | 35,776 | 36,274 | 36,646 | 36,825 | 36,903 | 36,958 | 36,994 | 36,685 | 35,450 | 33,555 |
| Pb | 1.47 | 0.52 | leaded gasoline out of use since 1997 | |||||||||||||
| Diesel fuels | ||||||||||||||||
| NH3 | 0.161 | 0.165 | 0.168 | 0.169 | 0.169 | 0.169 | 0.169 | 0.169 | 0.169 | 0.169 | 0.169 | 0.169 | 0.169 | 0.169 | 0.169 | 0.169 |
| NMVOC | 185 | 155 | 131 | 87.4 | 57.4 | 53.4 | 50.0 | 46.6 | 43.0 | 39.8 | 36.9 | 34.1 | 31.7 | 29.5 | 27.3 | 25.2 |
| NOx | 1,043 | 1,009 | 968 | 755 | 520 | 482 | 450 | 424 | 403 | 386 | 367 | 348 | 331 | 316 | 298 | 276 |
| SOx | 79.6 | 60.5 | 14.0 | 0.37 | 0.37 | 0.37 | 0.37 | 0.37 | 0.37 | 0.37 | 0.37 | 0.37 | 0.37 | 0.37 | 0.37 | 0.37 |
| BC5 | 78.5 | 64.0 | 51.0 | 36.1 | 27.3 | 26.1 | 25.0 | 23.7 | 22.1 | 20.6 | 19.0 | 17.5 | 16.0 | 14.6 | 13.0 | 11.3 |
| PM4 | 149 | 121 | 94.1 | 59.9 | 38.6 | 35.9 | 33.8 | 31.6 | 29.2 | 27.1 | 24.9 | 22.9 | 21.0 | 19.1 | 17.0 | 14.9 |
| CO | 584 | 576 | 545 | 414 | 319 | 307 | 297 | 286 | 273 | 260 | 248 | 236 | 225 | 215 | 205 | 195 |
1 due to lack of better information: similar EF are applied for fossil and biofuels
2 from fuel combustion
3 from gasoline evaporation
4 EF(PM2.5) also applied for PM10 and TSP (assumption: > 99% of TSP consists of PM2.5)
5 estimated via a f-BCs as provided in 5), Chapter 1.A.2.g vii, 1.A.4.a ii, b ii, c ii, 1.A.5.b i - Non-road, note to Table 3-1: Tier 1 emission factors for off-road machinery
6 from leaded gasoline (until 1997)
With respect to the emission factors applied for particulate matter, given the circumstances during test-bench measurements, condensables are most likely included at least partly. 1)
For lead (Pb) from leaded gasoline and corresponding TSP emissions, additional emissions are are calculated from 1990 to 1997 based upon contry-specific emission factors from 6).
For information on the emission factors for heavy-metal and POP exhaust emissions, please refer to Appendix 2.3 - Heavy Metal (HM) exhaust emissions from mobile sources and Appendix 2.4 - Persistent Organic Pollutant (POP) exhaust emissions from mobile sources.
Discussion of emission trends
Table: Outcome of Key Category Analysis
| for: | NOx | CO | BC | PM10 | PM2.5 |
|---|---|---|---|---|---|
| by: | Trend | Level | L | Trend | L & T |
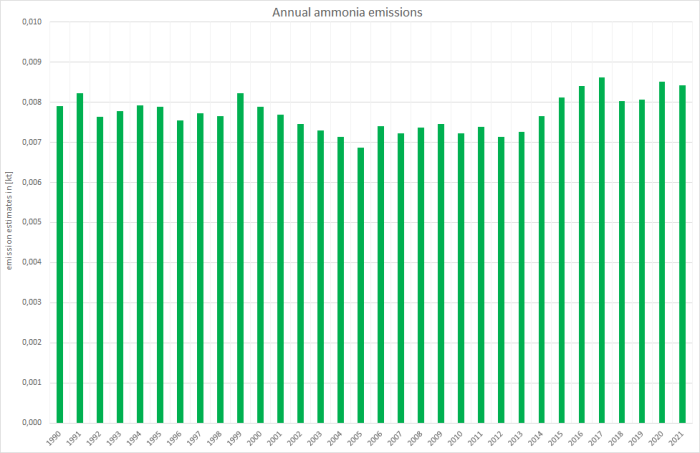
For all unregulated pollutants, emission trends directly follow the trend in fuel consumption.
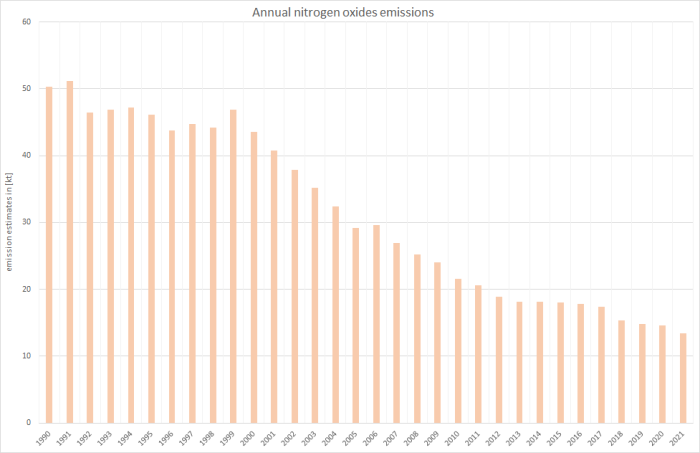
In contrast, for all regulated pollutants (such as NOx, SOx, NMVOC and particles), emission trends follow not only the trend in fuel consumption but also reflect the impact of fuel-quality and exhaust-emission legislation.
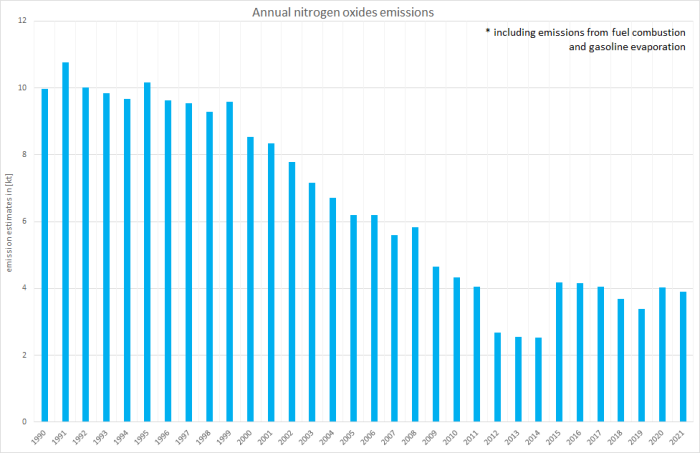
Here, as NMVOC emissions are dominated by gasoline fuels, the trend shows the same strong decline after 2011 as the underlying activity data (see above and NFR 1.A.4 - mobile, Table 1.) The remarkable increase after 2014 relates to the strongly increased gasoline inland deliveries reported in NEB line 67. (see table 3 above). This noticeable increase will be checked by the compiler of the National Energy Balance.
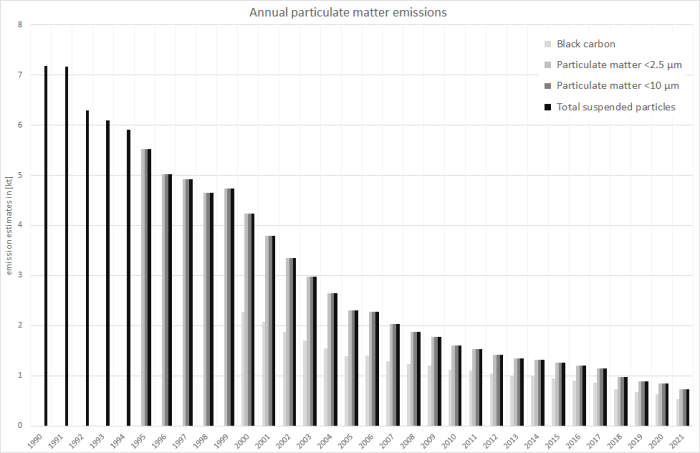
Over-all PM emissions are by far dominated by emissions from diesel oil combustion with the falling trend basically following the decline in fuel consumption between 2000 and 2005. Nonetheless, the decrease of the over-all emission trend was and still is amplified by the expanding use of particle filters especially to eliminate soot emissions.
Additional contributors such as the impact of TSP emissions from the use of leaded gasoline (until 1997) have no significant effect onto over-all emission estimates.
Recalculations
Revisions in activity data result from slightly revised annual shares adapted EBZ 67 shares as well as the implementation of primary activity data from the now finalised NEB 2019. Furthermore, for gasline fuels, all activity data have been revised due to a correction in NFR 1.A.5.b with impact on all sources included in NEN line 67.
Table 6: Revised annual shares of NEB line 67, in %
| 1990 | 1995 | 2000 | 2005 | 2010 | 2011 | 2012 | 2013 | 2014 | 2015 | 2016 | 2017 | 2018 | 2019 | 2020 | |
|---|---|---|---|---|---|---|---|---|---|---|---|---|---|---|---|
| DIESEL FUELS | |||||||||||||||
| Submission 2023 | 0,430 | 0,464 | 0,471 | 0,438 | 0,432 | 0,435 | 0,438 | 0,433 | 0,436 | 0,432 | 0,431 | 0,430 | 0,426 | 0,425 | 0,422 |
| Submission 2022 | 0,430 | 0,464 | 0,470 | 0,437 | 0,431 | 0,434 | 0,437 | 0,432 | 0,435 | 0,431 | 0,430 | 0,429 | 0,426 | 0,424 | 0,421 |
| absolute change | 0,001 | 0,001 | 0,001 | 0,001 | 0,001 | 0,001 | 0,001 | 0,001 | 0,001 | 0,001 | 0,001 | 0,001 | 0,001 | 0,001 | 0,001 |
| relative change | 0,17% | 0,17% | 0,17% | 0,16% | 0,16% | 0,16% | 0,15% | 0,15% | 0,15% | 0,15% | 0,15% | 0,16% | 0,16% | 0,16% | 0,16% |
| GASOLINE FUELS | |||||||||||||||
| Submission 2023 | 0,315 | 0,597 | 0,551 | 0,586 | 0,645 | 0,644 | 0,669 | 0,671 | 0,669 | 0,667 | 0,684 | 0,681 | 0,642 | 0,632 | 0,597 |
| Submission 2022 | 0,315 | 0,597 | 0,551 | 0,586 | 0,645 | 0,644 | 0,669 | 0,671 | 0,669 | 0,667 | 0,684 | 0,681 | 0,642 | 0,632 | 0,596 |
| absolute change | 0,000 | 0,000 | 0,000 | 0,000 | 0,000 | 0,000 | 0,000 | 0,000 | 0,000 | 0,000 | 0,000 | 0,000 | 0,000 | 0,000 | 0,000 |
| relative change | 0,01% | 0,00% | 0,02% | 0,02% | 0,01% | 0,01% | 0,01% | 0,01% | 0,01% | 0,01% | 0,01% | 0,01% | 0,01% | 0,02% | 0,02% |
Table 7: Revised activity data, in terajoules
| 1990 | 1995 | 2000 | 2005 | 2010 | 2011 | 2012 | 2013 | 2014 | 2015 | 2016 | 2017 | 2018 | 2019 | 2020 | |
|---|---|---|---|---|---|---|---|---|---|---|---|---|---|---|---|
| DIESEL FUELS | |||||||||||||||
| Submission 2022 | 48.161 | 45.414 | 44.743 | 38.239 | 41.151 | 42.211 | 41.748 | 42.525 | 44.777 | 46.146 | 47.756 | 49.053 | 45.663 | 46.059 | 48.170 |
| Submission 2021 | 48.078 | 45.337 | 44.668 | 38.177 | 41.085 | 42.145 | 41.684 | 42.460 | 44.710 | 46.075 | 47.682 | 48.977 | 45.591 | 45.987 | 47.614 |
| absolute change | 83,9 | 76,9 | 74,5 | 62,2 | 65,8 | 66,0 | 64,1 | 65,0 | 67,3 | 70,9 | 73,7 | 75,9 | 71,3 | 72,2 | 556 |
| relative change | 0,17% | 0,17% | 0,17% | 0,16% | 0,16% | 0,16% | 0,15% | 0,15% | 0,15% | 0,15% | 0,15% | 0,16% | 0,16% | 0,16% | 1,17% |
| GASOLINE FUELS | |||||||||||||||
| Submission 2022 | 1.420 | 4.453 | 4.079 | 4.313 | 2.954 | 2.690 | 874 | 861 | 912 | 3.510 | 3.590 | 3.565 | 3.365 | 3.064 | 4.142 |
| Submission 2021 | 1.420 | 4.453 | 4.079 | 4.312 | 2.954 | 2.689 | 874 | 861 | 912 | 3.509 | 3.590 | 3.565 | 3.365 | 3.063 | 3.293 |
| absolute change | 0,15 | -0,09 | 0,63 | 0,72 | 0,43 | 0,39 | 0,12 | 0,12 | 0,12 | 0,48 | 0,46 | 0,46 | 0,49 | 0,46 | 849 |
| relative change | 0,01% | 0,00% | 0,02% | 0,02% | 0,01% | 0,01% | 0,01% | 0,01% | 0,01% | 0,01% | 0,01% | 0,01% | 0,01% | 0,02% | 25,77% |
| OVER-ALL FUEL CONSUMPTION | |||||||||||||||
| Submission 2022 | 49.581 | 49.868 | 48.822 | 42.552 | 44.105 | 44.901 | 42.623 | 43.386 | 45.689 | 49.656 | 51.346 | 52.618 | 49.028 | 49.123 | 52.312 |
| Submission 2021 | 49.497 | 49.791 | 48.747 | 42.489 | 44.039 | 44.834 | 42.558 | 43.321 | 45.622 | 49.585 | 51.272 | 52.542 | 48.956 | 49.050 | 50.907 |
| absolute change | 84,1 | 76,8 | 75,1 | 62,9 | 66,2 | 66,4 | 64,2 | 65,1 | 67,4 | 71,4 | 74,2 | 76,4 | 71,8 | 72,7 | 1.405 |
| relative change | 0,17% | 0,15% | 0,15% | 0,15% | 0,15% | 0,15% | 0,15% | 0,15% | 0,15% | 0,14% | 0,14% | 0,15% | 0,15% | 0,15% | 2,76% |
As in contrast, all emission factors remain unrevised compared to last year's susbmission, emission estimates for the years as of 2015 change in accordance with the underlying activity data.
For pollutant-specific information on recalculated emission estimates for Base Year and 2020, please see the pollutant specific recalculation tables following chapter 8.1 - Recalculations.
Uncertainties
Uncertainty estimates for activity data of mobile sources derive from research project FKZ 360 16 023: “Ermittlung der Unsicherheiten der mit den Modellen TREMOD und TREMOD-MM berechneten Luftschadstoffemissionen des landgebundenen Verkehrs in Deutschland” by (Knörr et al. (2009)) 7).
Uncertainty estimates for emission factors were compiled during the PAREST research project. Here, the final report has not yet been published.
Planned improvements
Besides a routine revision of the TREMOD MM model, no specific improvements are planned.
FAQs
Why are similar EF applied for estimating exhaust heavy metal emissions from both fossil and biofuels?
The EF provided in 8) represent summatory values for (i) the fuel's and (ii) the lubricant's heavy-metal content as well as (iii) engine wear. Here, there might be no heavy metal contained in the biofuels. But since the specific shares of (i), (ii) and (iii) cannot be separated, and since the contributions of lubricant and engine wear might be dominant, the same emission factors are applied to diesel and biodiesel.


