meta data for this page
1.A.3.c - Transport: Railways
Short description
In category 1.A.3.c - Railways, emissions from fuel combustion in German railways and from the related abrasion and wear of contact line, braking systems and tyres on rails are reported.
| Category Code | Method | AD | EF | ||||||||||||
|---|---|---|---|---|---|---|---|---|---|---|---|---|---|---|---|
| 1.A.3.c | T1, T2 | NS, M | CS, D, M | ||||||||||||
| NOx | NMVOC | SO2 | NH3 | PM2.5 | PM10 | TSP | BC | CO | PB | Cd | Hg | Diox | PAH | HCB | |
| Key Category: | -/- | -/- | -/- | -/- | L/- | L/- | L/- | -/- | -/- | -/- | -/- | -/- | -/- | -/- | -/- |
Germany's railway sector is undergoing a long-term modernisation process, aimed at making electricity the main energy source for rail transports. Use of electricity, instead of diesel fuel, to power locomotives has been continually increased, and electricity now provides 80% of all railway traction power. Railways' power stations for generation of traction current are allocated to the stationary component of the energy sector (1.A.1.a) and are not included in the further description that follows here. In energy input for trains of German railways, diesel fuel is the only energy source that plays a significant role apart from electric power.
Methodology
Activity Data
Basically, total inland deliveries of diesel oil are available from the National Energy Balances (NEBs) (AGEB, 2022) 1). This data is based upon sales data of the Association of the German Petroleum Industry (MWV) 2). As a recent revision of MWV data on diesel oil sales for the years 2005 to 2009 has not yet been adopted to the respective NEBs, this original MWV data has been used for this five years.
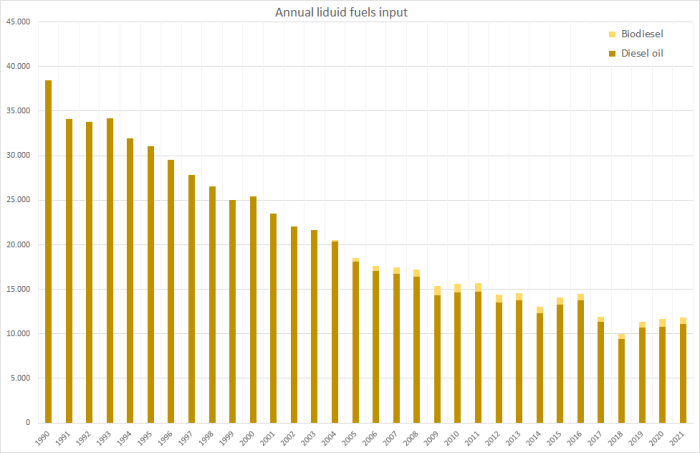
Data on the consumption of biodiesel in railways is provided in the NEBs as well, from 2004 onward. But as the NEBs do not provide a solid time series regarding most recent years, the data used for the inventory is estimated based on the prescribed shares of biodiesel to be added to diesel oil.
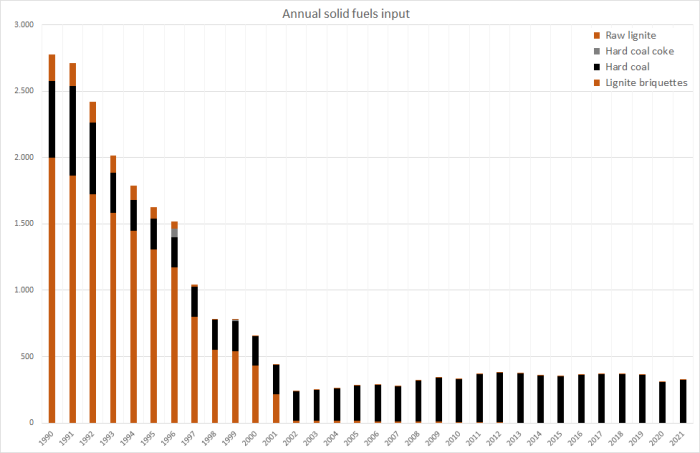
Small quantities of solid fuels are used for historical steam engines vehicles operated mostly for tourism and exhibition purposes. Official fuel delivery data are available for lignite, through 2002, and for hard coal, through 2000, from the NEBs. In order to complete these time series, studies were carried out in 2012 3), 2016 4) and 2021 5). During these studies, questionaires were provided to any known operator of historical steam engines in Germany. Here, due to limited data archiving, nearly complete data could only be gained for years as of 2005. For earlier years, in order to achieve a solid time series, conservative gap filling was applied.
Table 1: Overview of activity-data sources for domestic fuel sales to railway operators
| Activity | data source / quality of activity data |
|---|---|
| combustion of: | |
| Diesel oil | 1990-2004: NEB lines 74 and 61: 'Schienenverkehr' / 2005-2009: MWV annual report, table: 'Sektoraler Verbrauch von Dieselkraftstoff' / from 2010: NEB line 61 |
| Biodiesel | calculated from official blending rates |
| Hard coal | 1990-1994: NEB lines 74; 1995-2004: interpolated data; from 2005: original data from studies; 2016: forward extrapolation |
| Hard coal coke | 1990-1997: NEB lines 74 and 61; 1998-2004: interpolated data; from 2005: original data from studies; 2016: forward extrapolation |
| Raw lignite | from 1990: NEB lines 74 and 61 |
| Lignite briquettes | from 1990: NEB lines 74 and 61 |
| abrasion and wear of contact line, braking systems and tyres on rails: | |
| transport performance data | in Mio ptkm (performance-ton-kilometers) derived from the TREMOD model |
Table 2: Annual fuel consumption in German railways, in terajoules
| 1990 | 1995 | 2000 | 2005 | 2010 | 2011 | 2012 | 2013 | 2014 | 2015 | 2016 | 2017 | 2018 | 2019 | 2020 | 2021 | |
|---|---|---|---|---|---|---|---|---|---|---|---|---|---|---|---|---|
| Diesel Oil | 38,458 | 31,054 | 25,410 | 18,142 | 14,626 | 14,730 | 13,514 | 13,771 | 12,283 | 13,321 | 13,775 | 11,344 | 9,425 | 10,747 | 10,782 | 11,072 |
| Biodiesel | 0 | 0 | 0 | 401 | 957 | 974 | 890 | 804 | 751 | 727 | 729 | 606 | 548 | 612 | 896 | 769 |
| Liquids TOTAL | 38,458 | 31,054 | 25,410 | 18,543 | 15,583 | 15,704 | 14,404 | 14,575 | 13,034 | 14,048 | 14,504 | 11,950 | 9,973 | 11,359 | 11,678 | 11,841 |
| Lignite Briquettes | 0 | 0 | 0 | 0 | 0 | 0 | 0 | 0 | 0 | 0 | 0 | 0 | 0 | 0 | 0 | 0 |
| Raw Lignite | 200 | 86 | 1.33 | 0.79 | 0.79 | 0.76 | 0.74 | 0.71 | 0.68 | 0.66 | 0.63 | 0.46 | 0.46 | 0.43 | 0.22 | 0.35 |
| Hard Coal | 576 | 232 | 223 | 267 | 324 | 362 | 374 | 368 | 358 | 351 | 361 | 367 | 365 | 362 | 306 | 325 |
| Hard Coal Coke | 2,000 | 1,309 | 431 | 14.6 | 7.32 | 5.86 | 4.40 | 2.94 | 1.48 | 0.02 | 1.19 | 1.21 | 1.20 | 1.20 | 1.12 | 1.15 |
| Solids TOTAL | 2,776 | 1,627 | 655 | 283 | 332 | 368 | 379 | 372 | 360 | 352 | 363 | 368 | 367 | 363 | 308 | 327 |
| Ʃ 1.A.3.c | 41,234 | 32,681 | 26,065 | 18,826 | 15,915 | 16,073 | 14,783 | 14,947 | 13,395 | 14,400 | 14,867 | 12,318 | 10,340 | 11,722 | 11,985 | 12,168 |
The use of other fuels – such as vegetable oils or gas – in private narrow-gauge railway vehicles has not been included to date and may still be considered negligible.
Table 3: Annual transport performance, in Mio tkm (ton-kilometers)
| 1990 | 1995 | 2000 | 2005 | 2010 | 2011 | 2012 | 2013 | 2014 | 2015 | 2016 | 2017 | 2018 | 2019 | 2020 | 2021 | |
|---|---|---|---|---|---|---|---|---|---|---|---|---|---|---|---|---|
| Diesel | 98,812 | 58,805 | 37,237 | 26,540 | 26,702 | 27,403 | 26,791 | 23,768 | 23,734 | 21,397 | 21,484 | 21,484 | 21,365 | 19,580 | 18,058 | 16,917 |
| Electric | 361,515 | 337,853 | 361,633 | 356,605 | 344,546 | 342,701 | 350,085 | 335,298 | 331,235 | 323,387 | 295,798 | 295,798 | 296,280 | 288,336 | 281,130 | 262,268 |
| Ʃ 1.A.3.c | 460.326 | 396.658 | 398.870 | 383.145 | 371.248 | 370.104 | 376.876 | 359.065 | 354.970 | 344.785 | 317.282 | 317.282 | 317.645 | 307.916 | 299.188 | 279.184 |
Regarding particulate-matter and heavy-metal emissions from abrasion and wear of contact line, braking systems, tyres on rails, annual transport performances of railway vehicles with electrical and Diesel traction derived from Knörr et al. (2022a) 6) are applied as activity data.
Emission factors
The (implied) emission factors used here for estimating emissions from diesel fuel combustion of very different quality: For main pollutants, CO and PM, annual tier2 IEF computed within the TREMOD model are used, representing the development of German railway fleet, fuel quality and mitigation technologies 7). On the other hand, constant default values from (EMEP/EEA, 2019) 8) are used for all reported PAHs and heavy metals and from Rentz et al. (2008) 9) regarding PCDD/F. As no emission factors are available for HCB and PCBs, no such emissions have been calculated yet.
Regarding emissions from solid fuels used in historic steam engines, all emission factors displayed below have been adopted from small-scale stationary combustion.
Furthermore, regarding emissions from abrasion and wear, emission factors are calculated from PM10 emission estimates directly provided by the German railroad company Deutsche Bahn AG.
As these original emissions are only available as of 2013, implied EF(PM,10) were calculated from the emission estimates extrapolated backwards from 2013 to 1990 and the transport performance data available from TREMOD.
Regarding PM2.5, and TSP, due to leck of better information, a fractional distribution of 0.5 : 1 : 1 (PM2.5 : PM10 : TSP) is assumed for now. Emission factors for emssions of copper, nickel and chrome are calculated via typical shares of the named metals in the contact line (copper) and in the braking systems (Ni and Cr). Other heavy metals contained in alloys used for the contact line (silver, magnesium, tin) are not taken into account here. Furthermore, emissions from other wear parts (e.g. the current collector) are not estimated. However, these components are not supposed to contain any of the nine heavy metals to be reported here (current collectors are made of aluminium alloys and coal).
Table 3: Annual country-specific emission factors for diesel fuels1, in kg/TJ
| 1990 | 1995 | 2000 | 2005 | 2010 | 2011 | 2012 | 2013 | 2014 | 2015 | 2016 | 2017 | 2018 | 2019 | 2020 | 2021 | |
|---|---|---|---|---|---|---|---|---|---|---|---|---|---|---|---|---|
| NH3 | 0.54 | 0.54 | 0.54 | 0.54 | 0.54 | 0.54 | 0.54 | 0.54 | 0.54 | 0.54 | 0.54 | 0.54 | 0.54 | 0.54 | 0.54 | 0.54 |
| NMVOC | 109 | 100 | 90.2 | 64.8 | 52.0 | 54.1 | 44.7 | 42.2 | 41.6 | 39.2 | 39.0 | 37.8 | 36.8 | 36.3 | 37.7 | 36.8 |
| NOx | 1170 | 1207 | 1225 | 1111 | 970 | 989 | 919 | 899 | 885 | 826 | 802 | 776 | 749 | 707 | 741 | 744 |
| SOx | 196 | 60.5 | 14.1 | 0.32 | 0.32 | 0.32 | 0.32 | 0.32 | 0.33 | 0.32 | 0.33 | 0.33 | 0.33 | 0.33 | 0.33 | 0.33 |
| BC3 | 28.8 | 28.3 | 23.8 | 15.2 | 11.5 | 12.0 | 10.4 | 9.5 | 9.3 | 8.67 | 8.52 | 8.05 | 7.70 | 7.40 | 7.90 | 7.90 |
| PM | 44.4 | 43.6 | 36.6 | 23.4 | 17.7 | 18.4 | 16.0 | 14.7 | 14.3 | 13.3 | 13.1 | 12.4 | 11.8 | 11.4 | 12.2 | 12.2 |
| CO | 287 | 292 | 255 | 162 | 121 | 121 | 105 | 101 | 99.6 | 95.8 | 94.6 | 93.6 | 90.9 | 89.8 | 90.3 | 89.6 |
1 due to lack of better information: similar EF are applied for fossil diesel oil and biodiesel
2 EF(PM2.5) also applied for PM10 and TSP (assumption: >99% of TSP consists of PM2.5)
3 EFs calculated via f-BCs as provided in 10): diesel fuels: 0.56 (Chapter: 1.A.3.c - Railways, Appendix A: tier1), solid fuels: 0.064 (Chapter: 1.A.4 - Small Combustion: Residential combustion (1.A.4.b): Table 3-3, Zhang et al., 2012)
Table 4: Emission factors applied for solid fuels, in kg/TJ
| NH3 | NMVOC | NOx | SOx | PM2.5 | PM10 | TSP | BC | CO | |
|---|---|---|---|---|---|---|---|---|---|
| Hard coal | 4.00 | 15.0 | 120 | 650 | 222 | 250 | 278 | 14.2 | 500 |
| Hard coal coke | 4.00 | 0.50 | 120 | 500 | 15.0 | 15.0 | 15.0 | 0.96 | 1,000 |
Table 5: Country-specific emission factors for abrasive emissions, in g/km
| PM2.5 | PM10 | TSP | BC | Pb | Cd | Hg | As | Cr | Cu | Ni | Se | Zn | |
|---|---|---|---|---|---|---|---|---|---|---|---|---|---|
| Contact line 1 | 0.00016 | 0.00032 | 0.00032 | NA | NA | NA | NA | NA | NA | 0.00033 | NA | NA | NA |
| Tyres on rails 2 | 0.009 | 0.018 | 0.018 | NA | NA | ||||||||
| Braking system 3 | 0.004 | 0.008 | 0.008 | NA | NA | NA | NA | NA | 0.00008 | NA | 0.00016 | NA | NA |
| Current collector 4 | NE | NE | NE | NE | NA | ||||||||
1 assumption: 100 per cent copper
2 assumption: 100 per cent steel
3 assumption: steel alloy containing Chromium and Nickel
4 typically: aluminium alloy + coal contacts; no particulate matter emissions calculated yet
With respect to the emission factors applied for particulate matter, given the circumstances during test-bench measurements, condensables are most likely included at least partly. 1)
For information on the emission factors for heavy-metal and POP exhaust emissions, please refer to Appendix 2.3 - Heavy Metal (HM) exhaust emissions from mobile sources and Appendix 2.4 - Persistent Organic Pollutant (POP) exhaust emissions from mobile sources.
Discussion of emission trends
Table 6: Outcome of Key Category Analysis
| for: | TSP | PM10 | PM2.5 |
|---|---|---|---|
| by: | Level | L/- | L/- |
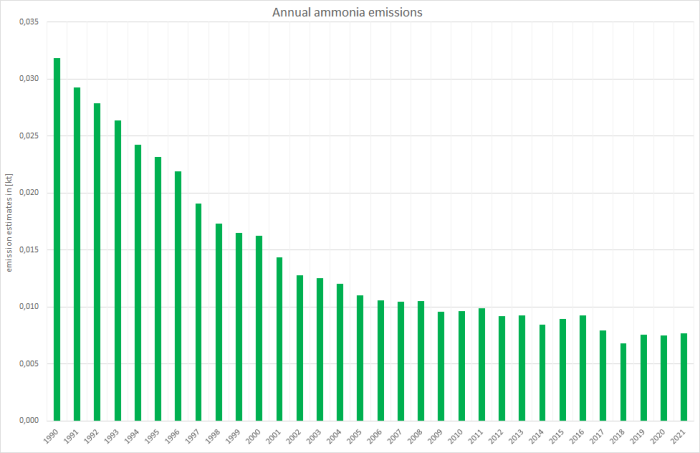
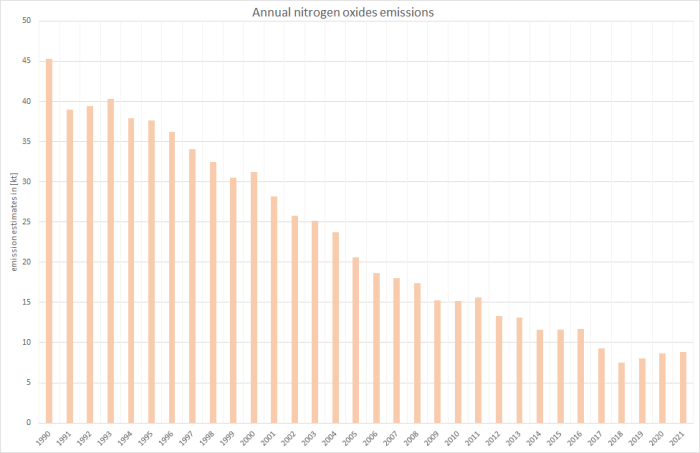
Basically, for all unregulated pollutants, emission trends directly follow the trend in over-all fuel consumption.
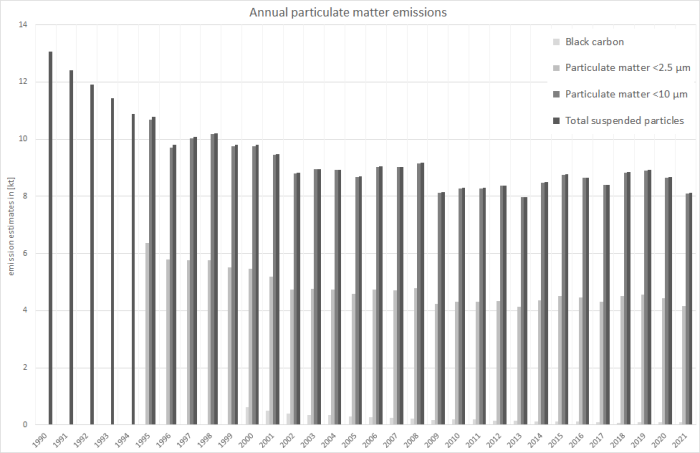
Here, as emission factors for solid fuels tend to be much higher than those for diesel oil, emission trends are disproportionately effected by the amount of solid fuels used. Therefore, for the main pollutants, carbon monoxide, particulate matter and PAHs, emission trends show remarkable jumps especially after 1995 that result from the significantly higher amounts of solid fuels used.
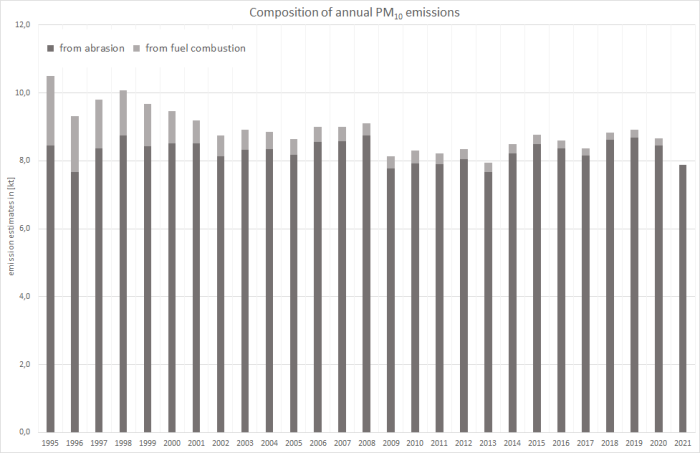
For all fractions of particulate matter, the majority of emissions generally result from abrasion and wear and the combustion of diesel fuels. Additional jumps in the over-all trend result from the use of lignite briquettes (1996-2001). Here, as the EF(BC) for fuel combustion are estimated via fractions provided in 11), black carbon emissions follow the corresponding emissions of PM2.5.
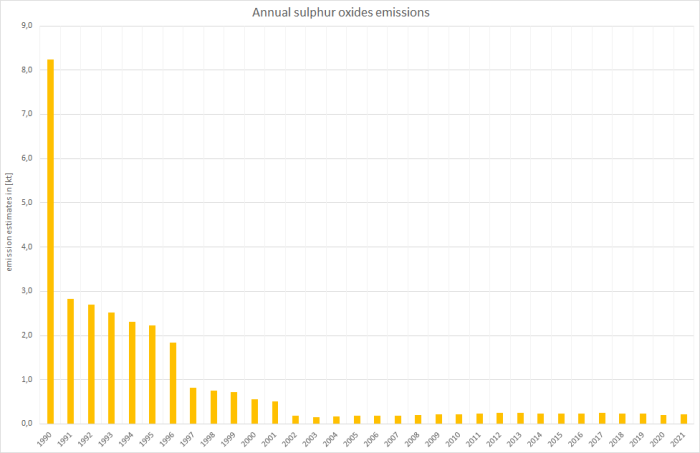
Due to fuel-sulphur legislation, the trend of sulphur dioxide emissions follows not only the trend in fuel consumption but also reflects the impact of regulated fuel-qualities. For the years as of 2005, sulphur emissions from diesel combustion have decreased so strongly, that the over-all trend shows a slight increase again due to the now dominating contribution of sulphur from the use of solid fuels.
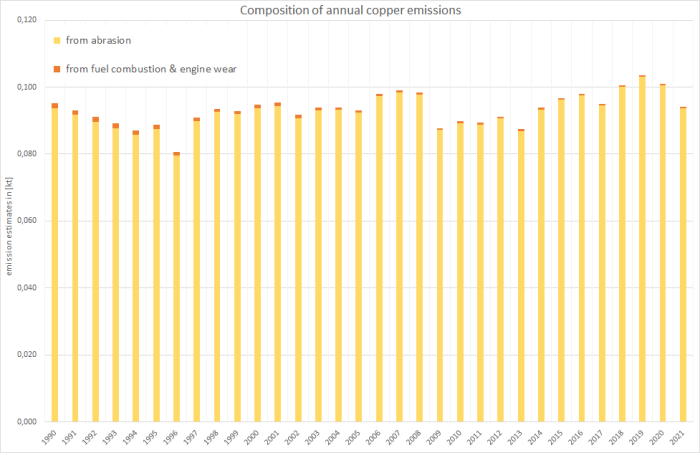
Regarding heavy metals, emissions from combustion of diesel oil and from abrasion and wear are estimated from tier1 default emission factors. Therefore, the emission trends reflect the development of diesel use and - for copper, chromium and nickel emissions resulting from the abrasion & wear of contact line and braking systems - the annual transport performance (see description of activity data above).
Recalculations
Given the revised NEB 2020, both the activity data for diesel oil and the annual amounts of blended biodiesel were revised accordingly.
Table 5: Revised fuel consumption data 2020, in terajoule
| DIESEL OIL | BIODIESEL | SOLID FUELS | ∑ | |
|---|---|---|---|---|
| current submission | 10,782 | 896 | 308 | 11,985 |
| previous submission | 10,145 | 843 | 308 | 11,295 |
| absolute change | 637 | 52.9 | 0 | 690 |
| relative change | 6.28% | 6.27% | 0.00% | 6.11% |
Due to the routine revision of the TREMOD model 12), tier2 emission factors changed for recent years.
Table 6: Revised country-specific emission factors for diesel fuels, in kg/TJ
| 1990 | 1995 | 2000 | 2005 | 2010 | 2011 | 2012 | 2013 | 2014 | 2015 | 2016 | 2017 | 2018 | 2019 | 2020 | |
|---|---|---|---|---|---|---|---|---|---|---|---|---|---|---|---|
| Non-methane volatile organic compounds - NMVOC | |||||||||||||||
| current submission | 109 | 100 | 90.2 | 64.8 | 52.0 | 54.1 | 44.7 | 42.2 | 41.6 | 39.2 | 39.0 | 37.8 | 36.8 | 36.3 | 37.7 |
| previous submission | 109 | 100 | 90.2 | 64.8 | 52.0 | 54.1 | 44.7 | 41.9 | 41.2 | 38.5 | 38.2 | 37.2 | 35.2 | 34.2 | 35.6 |
| absolute change | 0.00 | 0.00 | 0.00 | 0.00 | 0.00 | 0.00 | 0.00 | 0.34 | 0.49 | 0.68 | 0.78 | 0.58 | 1.55 | 2.11 | 2.15 |
| relative change | 0.00% | 0.00% | 0.00% | 0.00% | 0.00% | 0.00% | 0.00% | 0.82% | 1.18% | 1.76% | 2.03% | 1.56% | 4.42% | 6.19% | 6.04% |
| Nitrogen oxides - NOx | |||||||||||||||
| current submission | 1.170 | 1.207 | 1.225 | 1.111 | 970 | 989 | 919 | 899 | 885 | 826 | 802 | 776 | 749 | 707 | 741 |
| previous submission | 1.170 | 1.207 | 1.225 | 1.111 | 970 | 989 | 919 | 899 | 887 | 826 | 801 | 775 | 747 | 699 | 737 |
| absolute change | 0.00 | 0.00 | 0.00 | 0.00 | 0.00 | 0.00 | 0.00 | -0.34 | -1.32 | -0.12 | 0.99 | 0.60 | 2.82 | 7.51 | 4.15 |
| relative change | 0.00% | 0.00% | 0.00% | 0.00% | 0.00% | 0.00% | 0.00% | -0.04% | -0.15% | -0.01% | 0.12% | 0.08% | 0.38% | 1.07% | 0.56% |
| Black carbon - BC | |||||||||||||||
| current submission | 28.8 | 28.3 | 23.8 | 15.2 | 11.5 | 12.0 | 10.4 | 9.5 | 9.3 | 8.67 | 8.52 | 8.05 | 7.70 | 7.40 | 7.90 |
| previous submission | 28.8 | 28.9 | 24.2 | 16.1 | 11.4 | 11.5 | 12.0 | 10.4 | 9.5 | 9.29 | 8.65 | 8.48 | 8.05 | 7.60 | 7.18 |
| absolute change | 0.00 | -0.62 | -0.44 | -0.91 | 0.09 | 0.49 | -1.62 | -0.83 | -0.20 | -0.61 | -0.12 | -0.44 | -0.35 | -0.20 | 0.72 |
| relative change | 0.00% | -2.15% | -1.80% | -5.65% | 0.78% | 4.27% | -13.5% | -8.04% | -2.12% | -6.61% | -1.40% | -5.13% | -4.37% | -2.57% | 10.04% |
| Particulate matter - PM (PM2.5 = PM10 = TSP) | |||||||||||||||
| current submission | 44.4 | 43.6 | 36.6 | 23.4 | 17.7 | 18.4 | 16.0 | 14.7 | 14.3 | 13.3 | 13.1 | 12.4 | 11.8 | 11.4 | 12.2 |
| previous submission | 44.4 | 43.6 | 36.6 | 23.4 | 17.7 | 18.4 | 16.0 | 14.6 | 14.3 | 13.3 | 13.1 | 12.4 | 11.7 | 11.0 | 11.8 |
| absolute change | 0.00 | 0.00 | 0.00 | 0.00 | 0.00 | 0.00 | 0.00 | 0.05 | 0.03 | 0.04 | 0.06 | 0.00 | 0.15 | 0.34 | 0.35 |
| relative change | 0.00% | 0.00% | 0.00% | 0.00% | 0.00% | 0.00% | 0.00% | 0.33% | 0.23% | 0.32% | 0.46% | 0.00% | 1.29% | 3.10% | 2.96% |
| Carbon monoxide - CO | |||||||||||||||
| current submission | 287 | 292 | 255 | 162 | 121 | 121 | 105 | 101 | 100 | 95.8 | 94.6 | 93.6 | 90.9 | 89.8 | 90.3 |
| previous submission | 287 | 292 | 255 | 162 | 121 | 121 | 105 | 101 | 99 | 94.6 | 93.3 | 92.6 | 88.5 | 87.0 | 87.2 |
| absolute change | 0.00 | 0.00 | 0.00 | 0.00 | 0.00 | 0.00 | 0.00 | 0.52 | 0.78 | 1.16 | 1.34 | 1.08 | 2.43 | 2.80 | 3.04 |
| relative change | 0.00% | 0.00% | 0.00% | 0.00% | 0.00% | 0.00% | 0.00% | 0.52% | 0.79% | 1.23% | 1.43% | 1.17% | 2.75% | 3.22% | 3.49% |
Furthermore, the transport performance data as activity data for the estimation of abrasive emissions from current line, wheels and brakes have been revised for more recent years:
Table 7: Revised transport performance data, in [Mio km]
| 2015 | 2016 | 2017 | 2018 | 2019 | 2020 | |
|---|---|---|---|---|---|---|
| current submission | 344.785 | 317.282 | 317.282 | 317.645 | 307.916 | 299.188 |
| previous submission | 344.785 | 317.282 | 317.645 | 307.916 | 299.188 | 279.184 |
| absolute change | 0,00 | 0,00 | -363 | 9.729 | 8.728 | 20.003 |
| relative change | 0,00% | 0,00% | -0,11% | 3,16% | 2,92% | 7,16% |
Abrasive particulate matter and heavy metal emissions were revised accordingly.
For pollutant-specific information on recalculated emission estimates for Base Year and 2020, please see the recalculation tables following chapter 8.1 - Recalculations.
Uncertainties
Uncertainty estimates for activity data of mobile sources derive from research project FKZ 360 16 023 (title: “Ermittlung der Unsicherheiten der mit den Modellen TREMOD und TREMOD-MM berechneten Luftschadstoffemissionen des landgebundenen Verkehrs in Deutschland”) carried out by Knörr et al. (2009) 13).
Planned improvements
Besides the scheduled routine revision of TREMOD, no further improvements are planned for the next annual submission.
FAQs
Why are similar EF applied for estimating exhaust heavy metal emissions from both fossil and biofuels?
The EF provided in the 2019 EMEP/EEA Guidebook 14) represent summatory values for (i) the fuel's and (ii) the lubricant's heavy-metal content as well as (iii) engine wear. Here, there might be no heavy metals contained in the biofuels. But since the specific shares of (i), (ii) and (iii) cannot be separated, and since the contributions of lubricant and engine wear might be dominant, the same emission factors are applied to biodiesel.


