meta data for this page
Results - Overview
Modelling different scenarios in our database, we finally calculated the following numbers for Germany's emissions in 2030:
Table 3: Overview of projected 2030 emissions
| Projections for the year 2030 | NOx | SO2 | NMVOC | NH3 | PM2.5 |
|---|---|---|---|---|---|
| With measures | 500.9 kt | 138.4 kt | 763.8 kt | 434.2 kt | 75.4 kt |
| Amendment of the emission limits of the Ecodesign Regulations (EU) 2015/1185 1) and (EU) 2015/1189 2) | -0.8 kt | ||||
| [optional] Amendment of 13th BImSchV 3) | |||||
| With additional measures | 500.9 kt | 138.4 kt | 763.8 kt | 434.2 kt | 74.6 kt |
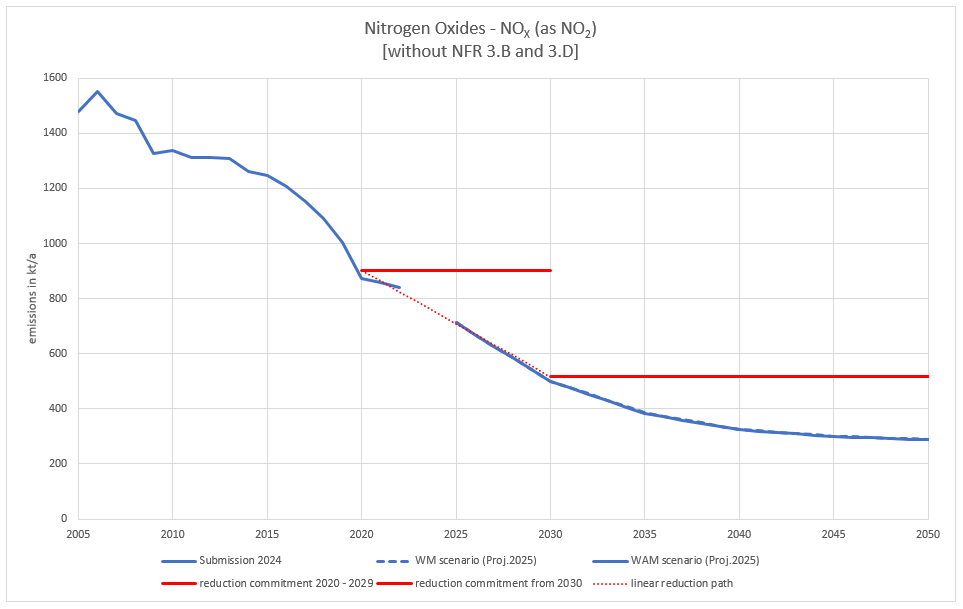
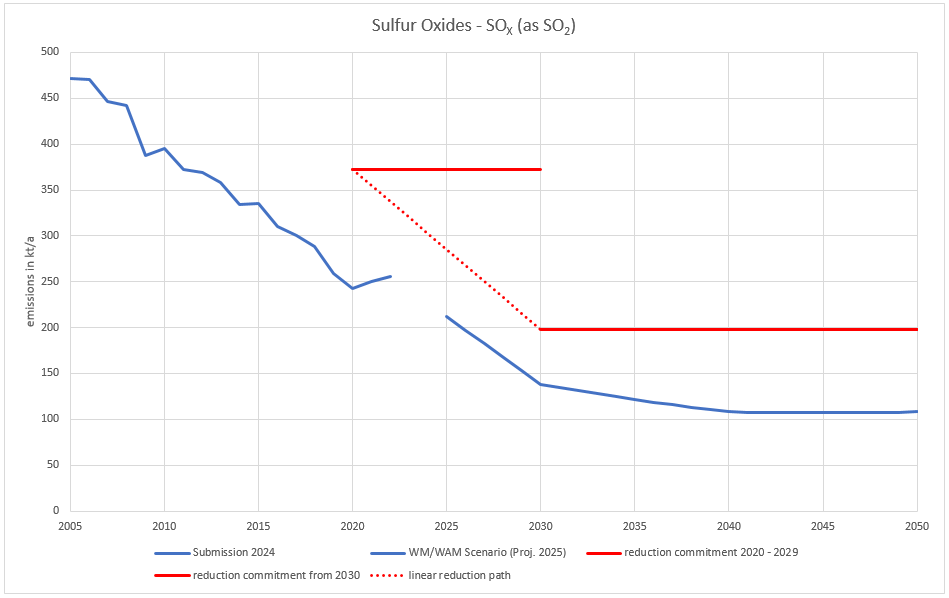
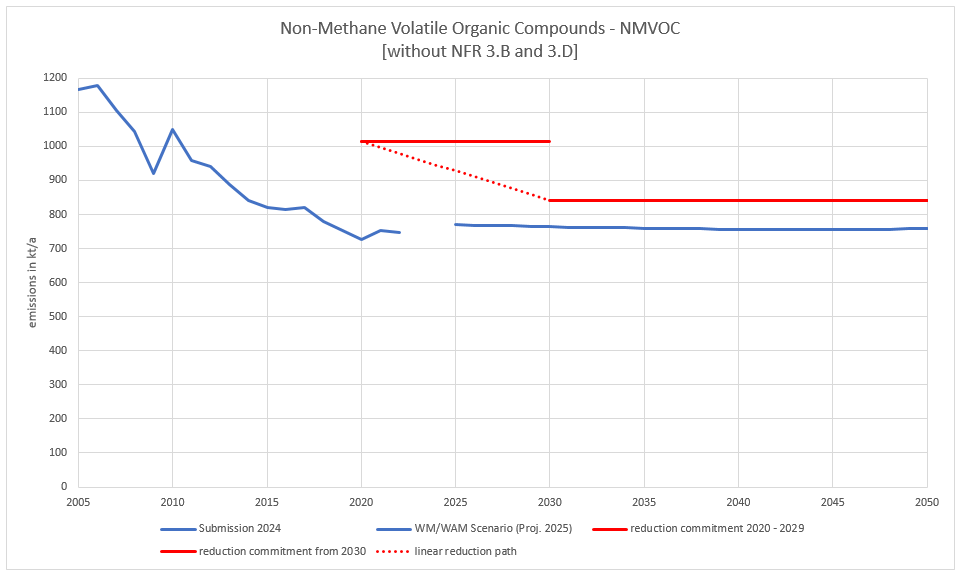
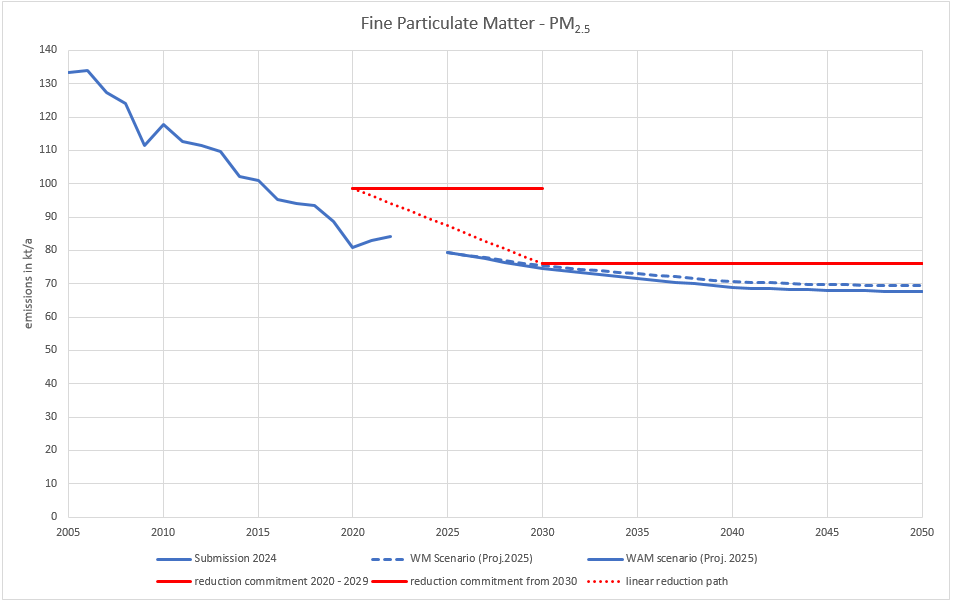
With these numbers, Germany will meet its reduction commitments for all pollutants in 2030 in both scenarios.
The following figures show the developments for each pollutant in the WM and WAM scenarios (WAM only for NOX and PM2.5 as there are no differences between both scenarios for all other pollutants). In addition, the reduction commitments for 2020 to 2029 and from 2030 onwards as well as the indicative linear reduction path are shown. Please note that projected emissions were only calculated for the years 2025, 2030, 2035, 2040, 2045 and 2050. A linear reduction in the years between cannot be assumed, but is shown in the graphs just for illustrative reasons.


