meta data for this page
1.A.1.c - Manufacture Of Solid Fuels And Other Energy Industries
Short description
Source category 1.A.1.c - Manufacture Of Solid Fuels And Other Energy Industries includes hard-coal and lignite mining, coking and briquetting plants and extraction of crude oil and natural gas. Used-oil processing plants are also included. Here, CO emissions from coking plants are reported in NFR sub-category 1.B.1.b.
| Category Code | Method | AD | EF | ||||||||||||
|---|---|---|---|---|---|---|---|---|---|---|---|---|---|---|---|
| 1.A.1.c | T2 | NS | CS | ||||||||||||
| Key Category | SO₂ | NOₓ | NH₃ | NMVOC | CO | BC | Pb | Hg | Cd | Diox | PAH | HCB | TSP | PM₁₀ | PM₂ ₅ |
| 1.A.1.c | L/T | L/T | -/- | -/- | -/- | -/- | -/- | L/T | L/T | -/- | -/- | -/- | L/T | -/T | -/T |
Method
Activity data
Fuel inputs for electricity production in power plants of the hard-coal and lignite mining sector are listed in Energy Balance line 12 “Industrial thermal power stations”. Fuel inputs for heat production in the transformation sector are listed in Energy Balance lines 33-39 (AGEB, 2019) 1).
Fuel inputs for electricity production in power stations of the hard-coal mining sector are determined with the help of figures of the Federal Statistical Office (DESTATIS). The activity rates for heat production in power stations of the hard-coal mining sector correspond to energy Balance line 34 “Energy input in pit and briquette plants of the hard-coal mining sector”. The listed fuel input for electricity and heat production in pit power plants is based on association information from DEBRIV (the federal German association of all lignite producing companies and their affiliated organisations). Inputs for heat production, especially for lignite drying for production of lignite products, are not shown in the Energy Balance. Those are calculated from figures for production of lignite products (STATISTIK DER KOHLENWIRTSCHAFT)2) and from the specific fuel inputs required for dying from DEBRIV.
Energy consumption data for hard-coal coke production are provided by the Energy Balance line 33.
The fuel input for heat production in the remaining transformation sector is obtained by combining the energy consumption figures in Energy Balance lines 33 to 39 (total energy consumption in the transformation sector). These figures include the pits' own consumption, facilities for petroleum and natural gas production and for processing of old oil; plants that produce coal products; plants for production and processing of fissile and fertile materials; and wastewater-treatment facilities.
Emission factors
The emission factors for power stations and other boiler combustion for production of steam and hot water, in source category 1.A.1.c, have been taken from the research project “Determination and evaluation of emission factors for combustion systems in Germany for the years 1995, 2000 and 2010” (Rentz et al., 2002)3). A detailed description of the procedure is presented in Chapter: 1.A.1.a - Public Electricity And Heat Production. In 2018 all emission factors for large combustion plants were revised (UBA, 2019)4).
Table 1: Implied emission factors for manufacture of solid fuels and other energy industry
| Pollutant | SOx | NOx | TSP | CO | Pb | Hg | Cd |
|---|---|---|---|---|---|---|---|
| Fuel | [kg/TJ] | [g/TJ] | |||||
| Hard Coal | 83.2 | 72.0 | 2.4 | 7.7 | 1.53 | 2.10 | 0.50 |
| Lignite | 128.3 | 86.9 | 3.6 | 26.3 | 1.41 | 2.77 | 0.16 |
| Pit gas | 2.0 | 118.0 | 0.3 | 72.0 | NE | NE | NE |
| Coke oven gas | 89.0 | 78.0 | 0.3 | 2.6 | NE | NE | NE |
| Sewage sludge | 2.0 | 29.0 | 0.5 | 2.2 | 3.20 | 2.40 | 0.34 |
The table gives an overview of the implied emission factors. In reality the German inventory compiling process is very complex and includes the use of a considerable number of emission factors, which cannot be published completely in the IIR. Actually there are different emission factors available for diverse fuel types, various techniques and licensing requirements. However, the implied emission factor may give an impression about the order of magnitude. PM10 and PM2.5 emission factors are calculated as a fraction of TSP. The share of PM10 is 90 % and the share of PM2.5 is 80 %. This is a simple but also conservative approach, knowing that, in reality, PM emissions depend on fuel, combustion and abatement technologies. PM emission reporting starts in 1995, since no sufficient information about the dust composition of the early 1990th is available. Emission factors of sewage sludge refer to mono-incineration, using fluidized-bed combustion. Emission factors of coke oven gas does not include underfiring systems of coking plants. The determination of emission factors of coking plants is described in the study: “Emissionsfaktoren zur Eisen und Stahlindustrie für die Emissionsberichterstattung” (VDEh, 2010) 5). Emission factors refer to the produced amount of coke, distinction is drawn between diffuse and channelled sources. The following graph gives an overview of the methodology:
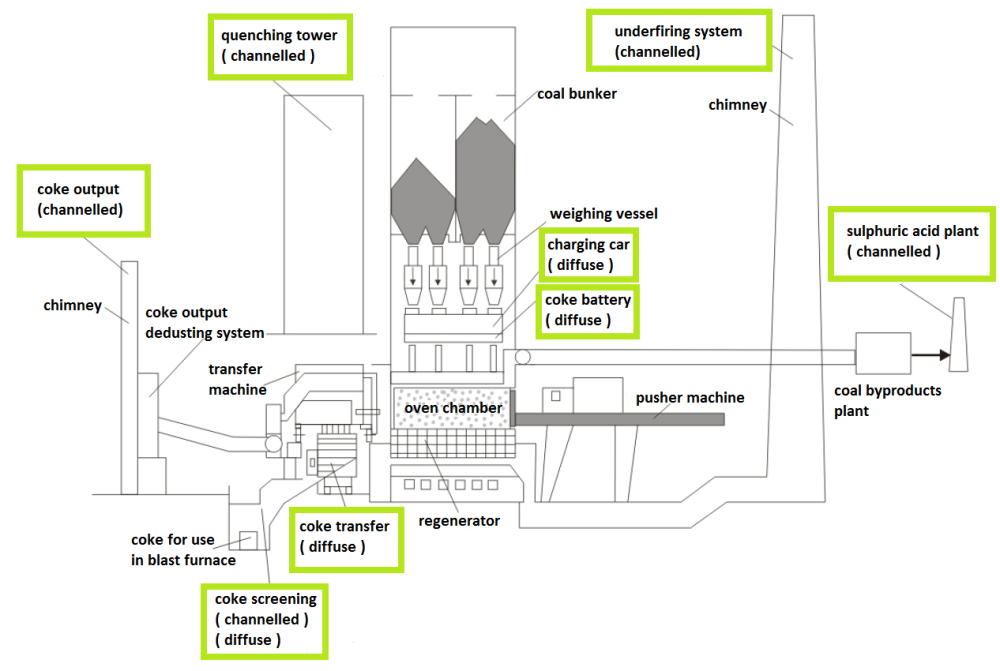
Table 2: emission factors for coking plants (solely channelled sources)
| Pollutant | SOx | NOx | CO | TSP | PM10 | NH3 | B[a]P | Benzene |
|---|---|---|---|---|---|---|---|---|
| Unit | [g/t product] | [mg/t product] | Unit | |||||
| 220.5 | 529.9 | 828.2 | 25.9 | 12.1 | 1.9 | 7.2 | 36.2 | |
Trend Discussion for Key Sources
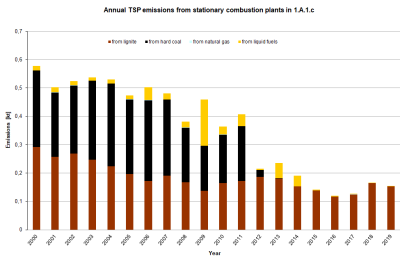
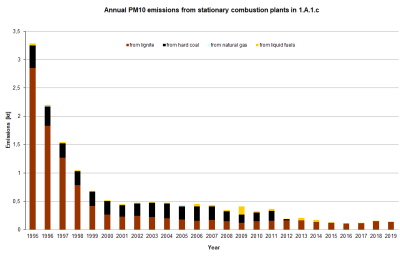
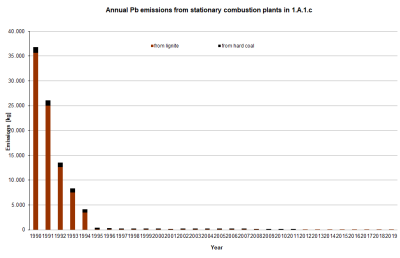
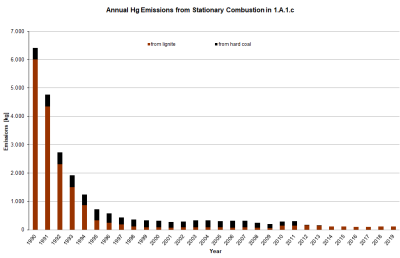
The following diagrams give an overview and assistance for explaining dominant emission trends of selected pollutants.
Sulfur Oxides - SOx
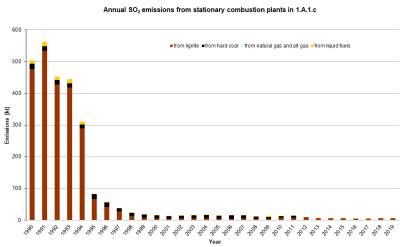
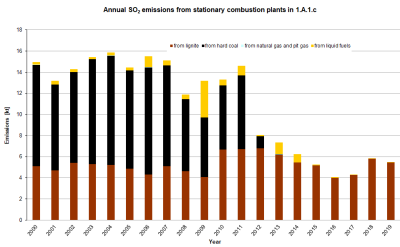
The graph shows sharp declining SOx emissions between 1990 and 1995 due to decreasing lignite consumption as well as the implementation of stricter regulations in eastern Germany. In the former GDR lignite industry was of prime importance for the economy. After the reunification lignite briquette production in eastern Germany collapsed. The remaining factories had to install flue gas desulphurisation plants. The strong decline of SO2 emissions in 2012 can be explained by the change of some power plants from the industrial to the public sector as a result of the closure of hard coal mines. A further reduction of SO2 emission factors followed in 2016 when the reduction efficiency of desulfurization plants increased from 95 to 96%. However, this effect is counterbalanced by the increased use of lignite.
Nitrogen Oxides - NOx
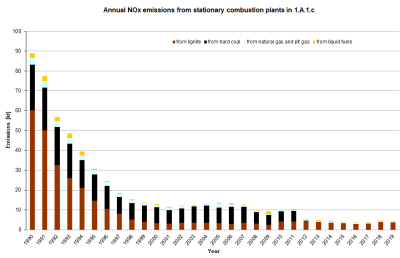
NOX emissions decrease gradually from 1990 to 2001. The main reasons are the minor fuel use of lignite and of hard coal in this sector and the adaptation of regulations in eastern Germany to the western standard. Besides German hard coal production decreased considerably since 1990. Therefore some hard coal fired industrial power plants changed from sector 1.A.1.c to the public sector. This is also the reason for the significant emission reduction in 2012.
Total Suspended Matter - TSP & PM₁₀
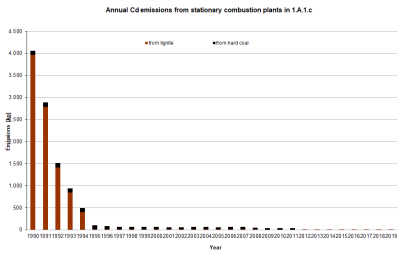
Priority Heavy Metal - Pb & Hg & Cd
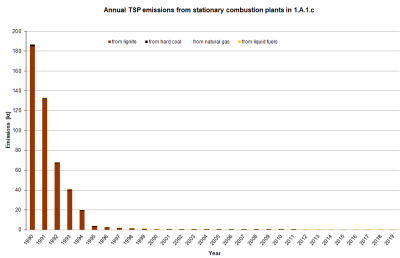
Similar to SOx emissions, TSP and Priority Heavy Metal emission trends show a high dominance of emissions from lignite combustion. Like already discussed for other pollutant, the main reason for sharp declining emissions in this sector is the complete restructuring of the east German lignite industry. The low standard of dust abatement in eastern Germany in the early 1990s involved high heavy metal emissions too. The closing of briquette factories and the implementation of stricter regulations resulted in a considerably improvement of the air quality especially in the New German Länder.
Recalculations
Recalculations were necessary for the latest reference year (2018) due to the availability of the National Energy Balance. Germany has a federal structure which causes a time lack of the National Energy Balance. Therefore recalculations are always necessary.
For more information on recalculated emission estimates for Base Year and 2018, please see the pollutant specific recalculation tables following chapter 8.1 - Recalculations.
Planned improvements
At the moment, no category-specific improvements are planned.


