meta data for this page
1.A.3.b vi - Road Transport: Automobile Tyre and Brake Wear
Short description
In sub-categories 1.A.3.b vi - Road transport: Automobile tyre and brake wear emissions from automobile tyre and brake wear in RT are reported. Therefore, these sub-category is an important source for a) particle emissions and b) emissions of heavy metals, POPs etc. included in these particles.
| Category Code | Method | AD | EF | ||||||||||||
|---|---|---|---|---|---|---|---|---|---|---|---|---|---|---|---|
| 1.A.3.b vi | T1, T3 | NS, M | CS | ||||||||||||
| Key Category | SO2 | NOx | NH3 | NMVOC | CO | BC | Pb | Hg | Cd | Diox | PAH | HCB | TSP | PM10 | PM2.5 |
| 1.A.3.b vi | - | - | - | - | - | L/- | L/- | - | -/- | - | -/- | - | L/- | L/T | L/- |
Methodology
Activity data
Abrasive emissions from tyre and brake wear are estimated based on vehicle-type specific mileage data.
For detailed mileage data, please see superordinate chapter on abrasive emissions from road vehicles.
Emission factors
Table 1: Emission factors applied
| Tyre Wear | Brake Wear | ||||||||||||
|---|---|---|---|---|---|---|---|---|---|---|---|---|---|
| PCs | LDVs | HDVs | Buses | Mopeds | Motorcycles | PCs | LDVs | HDVs | Buses | Mopeds | Motorcycles | ||
| BC | [mg/km] | 1,07 | 1,69 | 4,50 | 4,50 | 0,55 | 0,55 | 0,75 | 1,17 | 3,27 | 3,27 | 0,44 | 0,44 |
| PM2.5 | 4,49 | 7,10 | 18,9 | 18,9 | 1,93 | 1,93 | 2,93 | 4,56 | 12,7 | 12,7 | 1,44 | 1,44 | |
| PM10 | 6,40 | 10,1 | 27,0 | 24,3 | 2,80 | 2,80 | 7,35 | 11,5 | 32,0 | 28,8 | 3,63 | 3,63 | |
| TSP | 10,7 | 16,9 | 45,0 | 45,0 | 4,60 | 4,60 | 7,50 | 11,7 | 32,7 | 32,7 | 3,70 | 3,7 | |
| Pb | [µg/km] | 1,88 | 2,97 | 4,26 | 3,10 | 0,81 | 0,81 | 45,5 | 71,0 | 199 | 199 | 22,5 | 22,5 |
| Hg | 0 | 0 | 0 | 0 | 0 | 0 | 0 | 0 | 0 | 0 | 0 | 0 | |
| Cd | 0,05 | 0,08 | 0,11 | 0,08 | 0,02 | 0,02 | 0,17 | 0,26 | 0,73 | 0,73 | 0,08 | 0,08 | |
| As | 0,04 | 0,06 | 0,09 | 0,07 | 0,02 | 0,02 | 0,51 | 0,79 | 2,21 | 2,21 | 0,25 | 0,25 | |
| Cr | 0,26 | 0,40 | 0,58 | 0,42 | 0,11 | 0,11 | 17,3 | 27,0 | 75,7 | 75,7 | 8,55 | 8,55 | |
| Cu | 1,86 | 2,94 | 4,21 | 3,06 | 0,80 | 0,80 | 383 | 598 | 1674 | 1674 | 189 | 189 | |
| Ni | 0,32 | 0,51 | 0,72 | 0,53 | 0,14 | 0,14 | 2,45 | 3,83 | 10,71 | 10,71 | 1,21 | 1,21 | |
| Se | 0,21 | 0,34 | 0,48 | 0,35 | 0,09 | 0,09 | 0,15 | 0,23 | 0,66 | 0,66 | 0,07 | 0,07 | |
| Zn | 79,5 | 126 | 180 | 131 | 34,2 | 34,2 | 65,1 | 102 | 284 | 284 | 32,1 | 32,1 | |
| B[a]P | 0,032 | 0,049 | 0,134 | 0,120 | 0,013 | 0,013 | NA | NA | NA | NA | NA | NA | |
| B[b]F | 0,038 | 0,063 | 0,161 | 0,144 | 0,019 | 0,019 | NA | NA | NA | NA | NA | NA | |
| B[k]F | 0 | 0 | 0 | 0 | 0 | 0 | NA | NA | NA | NA | NA | NA | |
| I[..]P | 0,019 | 0,028 | 0,082 | 0,072 | 0,006 | 0,006 | NA | NA | NA | NA | NA | NA | |
| ∑ PAHs 1-4 | 0,090 | 0,140 | 0,379 | 0,336 | 0,038 | 0,038 | NA | NA | NA | NA | NA | NA | |
Discussion of emission trends
(emissions from wear/abrasion only; no fuel combustion included)
Table: Outcome of Key Category Analysis
| for: | BC | Pb | TSP | PM10 | PM2.5 |
|---|---|---|---|---|---|
| by: | Level | L/- | L/- | Level & Trend | L/- |
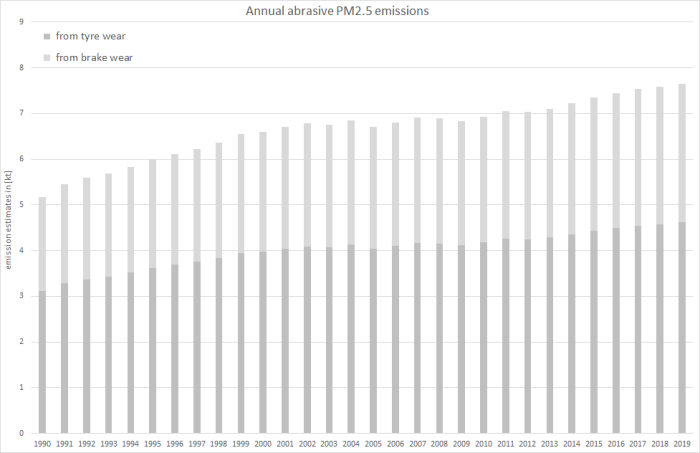
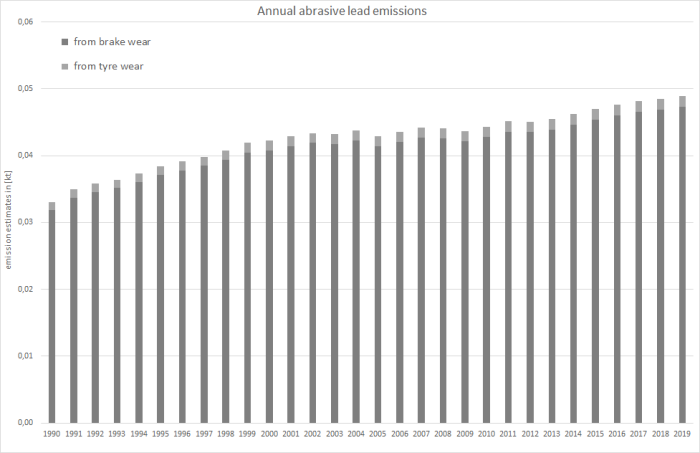
All reported emissons from tyre and brake wear are connected directly to the mileage driven by the road vehicles covered.
Recalculations
Activity data (mileage) have been revised due to the regular revision of the TREMOD model. (see superordinate chapter ).
However, the biggest changes occur in the tier1 emission factors that have been revised during a research study. The variety of old and revised emission factors cannot be compared here in a comprehendible way.
For more information on recalculated emission estimates for Base Year and 2018, please see the pollutant-specific recalculation tables following chapter 8.1 - Recalculations.
Planned improvements
Besides a routine revision of the underlying model, no specific improvements are planned.


