meta data for this page
1.A.5.b - Other, Mobile (including Military)
Short description
In sub-category 1.A.5.b - Other, Mobile (including Military) emissions from landbased, air- and waterborne military vehicles are reported.
| NFR-Code | Name of Category | Method | AD | EF | Key Category Analysis |
|---|---|---|---|---|---|
| 1.A.5.b | Other, Mobile (including Military) | see sub-category details | see below | ||
| 1.A.5.b i | Land-based military transport and machinery | T1, T2 | NS | CS, D | - |
| 1.A.5.b ii | Military Aviation | T1, T2 | NS | CS, D | - |
| 1.A.5.b iii | Military Navigation | T1, T2, T3 | NS, M | CS, D, M | - |
| NOx | NMVOC | SO2 | NH3 | PM2.5 | PM10 | TSP | BC | CO | PB | Cd | Hg | Diox | PAH | HCB | |
|---|---|---|---|---|---|---|---|---|---|---|---|---|---|---|---|
| Key Category: | -/T | -/- | -/- | -/- | -/- | -/- | -/- | -/- | -/- | -/- | -/- | -/- | -/- | -/- | -/- |
For further information on sub-sector specific consumption data, emission factors and emissions as well as further information on emission trends, recalculations and planned improvements, please follow the links above.
Methodology
Activity data
Basically, all fuel deliveries to the military are included in the primary fuel delivery data provided by the National Energy Balances (NEB) 1). As the NEB does not provide specific data for military use, the following additional sources are used:
Military land-based vehicles and aviation:
For the years as of 1995, the official mineral-oil data of the Federal Republic of Germany (Amtliche Mineralöldaten der Bundesrepublik Deutschland), prepared by the Federal Office of Economics and Export Control (BAFA), are used 2). Provided in units of [1000 t], these amounts have to be converted into [TJ] on the basis of the relevant net calorific values given by 3).
As the official mineral-oil data does not distinguish into fossil and biofuels but does provide amounts for inland deliveries of total diesel and gasoline fuels, no data on the consumption of biodiesel and bioethanol is available directly at the moment. Therefore, activity data for biofuels used in military vehicles are calculated by applying Germany's official annual biofuel shares to the named total deliveries (see also: info on EF).
As there is no consistent NEB data availabe for aviation gasoline, delivery data from BAFA is applied for the entire time series.
Military navigation:
Primarilly, fuel deliveries to military navigation is included in the NEB data provided in NEB lines 6: 'International Deep-Sea Bunkers' and 64: 'Coastal and inland navigation' but cannot be derived directly. Therefore, starting with this submission, fuel use in military navigation is estimated within a specific model used for estimating emissions from German maritime activities 4).
Table 1: Sources for consumption data in 1.A.5.b
| Mode of Military Transport | Specific AD included in: | Sources for specific data | Relevant years |
|---|---|---|---|
| Military ground vehicles and mobile machinery, military aviation | NEB line 67 - 'Commerce, Trade, Services and other Consumers' | Special evaluation 1990-1994 carried out by AGEB | 1990 - 1994 |
| Official oil data, table 7j, column: 'An das Militär', 5) | as of 1995 | ||
| Military Navigation | NEB lines 6 - 'International Deep-Sea Bunkers' and 64 - 'Coastal and Inland Navigation' | AD estimated within 6) | as of 1990 |
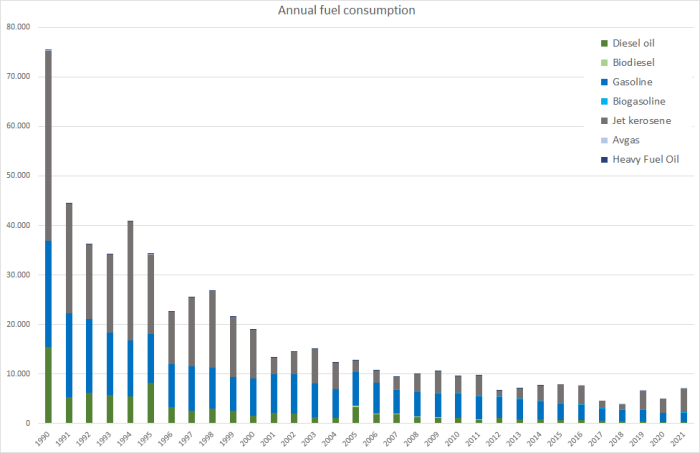
Table 2: Annual over-all fuel consumption in military vehicles and mobile equipment, in terajoules
| 1990 | 1995 | 2000 | 2005 | 2010 | 2011 | 2012 | 2013 | 2014 | 2015 | 2016 | 2017 | 2018 | 2019 | 2020 | 2021 | |
|---|---|---|---|---|---|---|---|---|---|---|---|---|---|---|---|---|
| DIESEL OIL | 15,417 | 8,264 | 1,592 | 3,377 | 1,127 | 763 | 1,104 | 791 | 787 | 734 | 719 | 571 | 412 | 445 | 328 | 256 |
| GASOLINE | 0 | 0 | 0 | 214 | 74.9 | 43.2 | 68.2 | 40.3 | 41.9 | 31.7 | 30.6 | 22.1 | 16.2 | 16.0 | 11.1 | 9.55 |
| BIODIESEL | 21,508 | 9,800 | 7,477 | 6,838 | 4,792 | 4,624 | 4,106 | 4,027 | 3,635 | 3,287 | 2,959 | 2,463 | 2,300 | 2,269 | 1,770 | 1,921 |
| BIOGASOLINE | 0 | 0 | 0 | 47.0 | 185 | 190 | 182 | 173 | 158 | 143 | 129 | 104 | 103 | 97.9 | 80.8 | 91.4 |
| JET KEROSENE | 38,385 | 16,143 | 9,862 | 2,200 | 3,286 | 4,114 | 1,171 | 2,049 | 3,060 | 3,726 | 3,845 | 1,507 | 1,025 | 3,746 | 2,904 | 4,810 |
| AVGAS | 15.2 | 6.35 | 1.09 | 0.26 | 0.17 | 0.00 | 0.00 | 0.00 | 0.00 | 0.00 | 0.13 | 0.00 | 0.17 | 0.04 | 0.00 | 0.09 |
| HEAVY FUEL OIL | 152 | 104 | 90.4 | 67.4 | 59.0 | 56.5 | 54.0 | 43.9 | 60.5 | |||||||
| Ʃ 1.A.5.b | 75,477 | 34,317 | 19,022 | 12,744 | 9,524 | 9,791 | 6,685 | 7,124 | 7,742 | 7,921 | 7,682 | 4,666 | 3,856 | 6,574 | 5,094 | 7,088 |
source: (BAFA, 2022) 7): Amtliche Mineralöldaten für die Bundesrepublik Deutschland, Table 7j: “an das Militär” (“to the military”) and own estimates for blended biofuels
Table 3: Further break-down of annual military fuel consumption, in terajoules
| 1990 | 1995 | 2000 | 2005 | 2010 | 2011 | 2012 | 2013 | 2014 | 2015 | 2016 | 2017 | 2018 | 2019 | 2020 | 2021 | |
|---|---|---|---|---|---|---|---|---|---|---|---|---|---|---|---|---|
| used in military ground vehicles and machinery | ||||||||||||||||
| Diesel Oil | 15,037 | 8,001 | 1,364 | 3,206 | 977 | 620 | 966 | 680 | 683 | 580 | 577 | 415 | 279 | 281 | 133 | 138 |
| Biodiesel | 0 | 0 | 0 | 214 | 74.9 | 43.2 | 68.2 | 40.3 | 41.9 | 31.7 | 30.6 | 22.1 | 16.2 | 16.0 | 11.1 | 9.55 |
| Gasoline | 21,508 | 9,800 | 7,477 | 6,838 | 4,792 | 4,624 | 4,106 | 4,027 | 3,635 | 3,287 | 2,959 | 2,463 | 2,300 | 2,269 | 1,770 | 1,921 |
| Biogasoline | 0 | 0 | 0 | 47.0 | 185 | 190 | 182 | 173 | 158 | 143 | 129 | 104 | 103 | 97.9 | 80.8 | 91.4 |
| used in military aircraft | ||||||||||||||||
| Jet Kerosene | 38,385 | 16,143 | 9,862 | 2,200 | 3,286 | 4,114 | 1,171 | 2,049 | 3,060 | 3,726 | 3,845 | 1,507 | 1,025 | 3,746 | 2,904 | 4,810 |
| Aviation Gasoline | 15.2 | 6.35 | 1.09 | 0.26 | 0.17 | 0.00 | 0.00 | 0.00 | 0.00 | 0.00 | 0.13 | 0.00 | 0.17 | 0.04 | 0.00 | 0.09 |
| used in military navigation | ||||||||||||||||
| Diesel Oil | 380 | 263 | 228 | 171 | 150 | 144 | 138 | 111 | 104 | 154 | 141 | 156 | 133 | 164 | 195 | 118 |
| Heavy Fuel Oil | 152 | 104 | 90.4 | 67.4 | 59.0 | 56.5 | 54.0 | 43.9 | 60.5 | 0 | 0 | 0 | 0 | 0 | 0 | 0 |
| Ʃ 1.A.5.b | ||||||||||||||||
| all types of fuels applied | 75,477 | 34,317 | 19,022 | 12,744 | 9,524 | 9,791 | 6,685 | 7,124 | 7,742 | 7,921 | 7,682 | 4,666 | 3,856 | 6,574 | 5,094 | 7,088 |
source: (BAFA, 2022): Amtliche Mineralöldaten für die Bundesrepublik Deutschland, Table 7j: “an das Militär” (“to the military”); Deichnik, 2022 (for fuel consumption in military navigation) and own estimates for blended biofuels
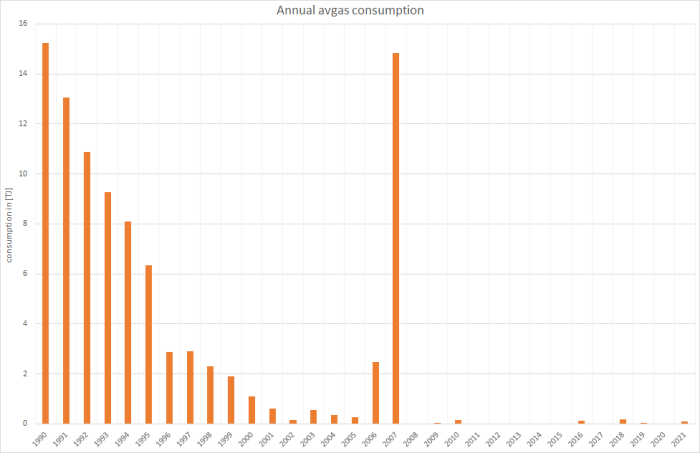
As the “consumption data” provided here originally represents fuel delivery data, some trends in “annual consumption” are influenced by stock-keeping activities. Here, a clear impact of storage effects can be observed for avgas, where a significantly high amount of 15 TJ was purchased in 2007 followed by zero or very small deliveries.
Furthermore, based upon expert information, no biodiesel or heavy fuel oil is used in national military navigation.
Emission factors
For further information on sub-sector specific emission factors, please refer to the sub-chapters on ground-based , airborne and naval military activities.
Discussion of emission trends
Table: Outcome of Key Category Analysis
| for: | NOx |
|---|---|
| by: | Trend |
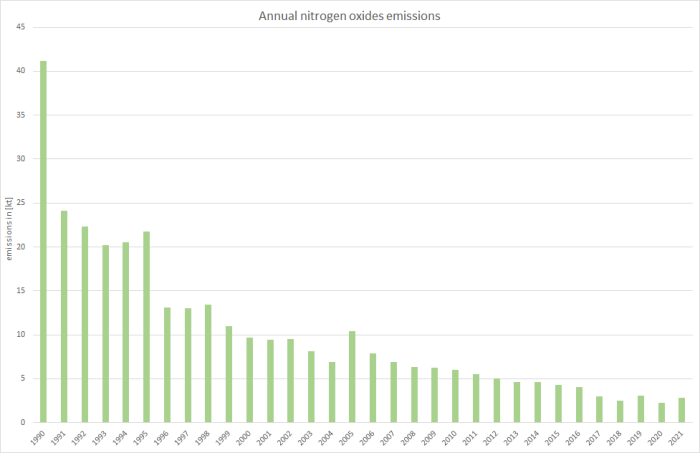
Here, due to the tier1 emission factors applied, annual emissions strongly correspond with activity data, therefore showing strong decline after 1990 and an ongoing downward trend.
Regarding the peak in NOx emissions 2005: The dominating source of NOx (and PM) emissions is the use of diesel oil in militar ground vehicles and machinery as well as military vessels. Here, the underlying activity data (annual diesel oil inland deliveries) for 2005 are well above the values of previous and following years but cannot be revised in a sensible way.
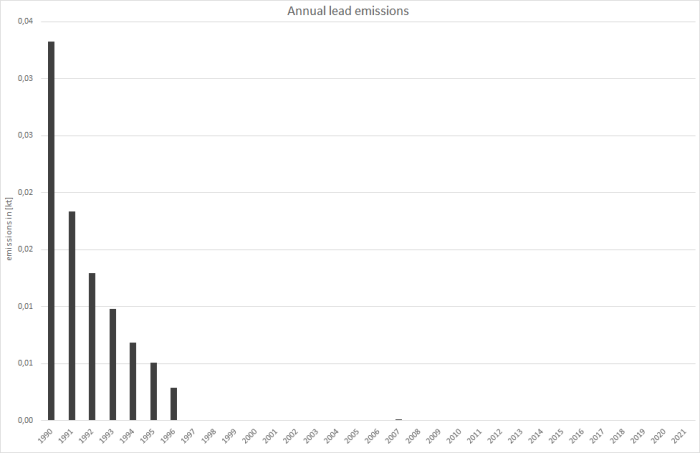
Furthermore, this NFR category shows interesting trends for emissions of Lead (Pb) from leaded gasoline (until 1997) and aviation gasoline:
Until 1997, lead emissions were dominated by the combustion of leaded gasoline in military ground-based vehicles. Therefore, the over-all trend for lead emissions from military vehicles and aircraft is driven mostly by the abolition of leaded gasoline in 1997. Towards this date, the amount of leaded gasoline decreased significantly. After 1997, the only source for lead from mobile fuel combustion is avgas used in military aircraft. As for avgas, the trend of consumption is more or less drecreasing steadily until 2005 but then shows a strong increase for 2006 and '07 (!), followed by no or very small deliveries. As mentioned above, there are no real consumption data available: AD is based on fuel deliveries to the military only. Thus, especially the trends for the use of aviation gasoline and the resulting emissions show this siginificant jumps in 2006 and 07. The party is aware of this issue and will try to solve it as soon as data allows. (see also: FAQ)
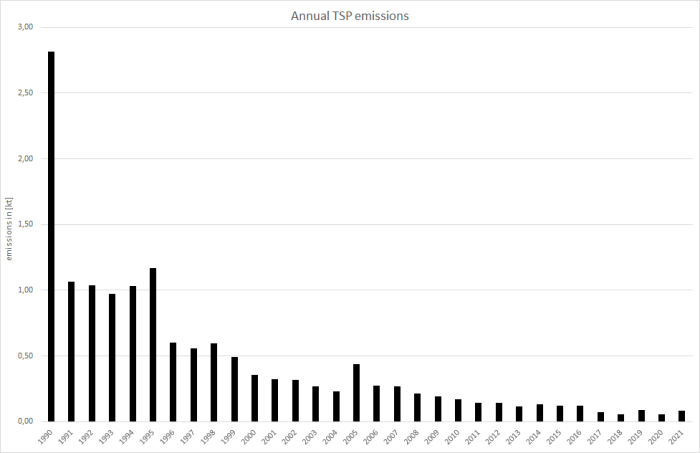
The trend for TSP emissions reflects the impact of leaded gasoline at least for 1990 to 1997. For all other years, particulate matter emissions simply follow the trend in over-all fuel consumption.
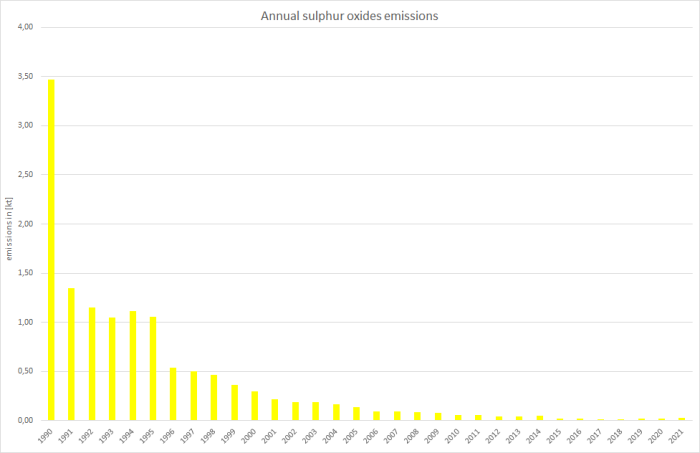
Regarding sulphur dioxide, emssions not only reflect the trend of fuel consumption but also the impact of fuel-sulphur legislation.
For all other reported pollutants, due to the application of tier1 emission factors, emission trends reported for this sub-category only reflect the trend in fuel deliveries.
Recalculations
Recalculations against last year's submission occur solely for 2020 and result from slightly revised emission factors applied for military vessels.
| NH3 | NMVOC | NOx | SOx | BC | PM2.5 | PM10 | TSP | CO | |
|---|---|---|---|---|---|---|---|---|---|
| current submission | 0,020 | 1,02 | 2,28 | 0,02 | 0,026 | 0,06 | 0,058 | 0,058 | 8,89 |
| previous submission | 0,020 | 1,02 | 2,38 | 0,02 | 0,028 | 0,06 | 0,063 | 0,063 | 8,91 |
| absolute change | 0,000 | 0,00 | -0,10 | 0,00 | -0,002 | -0,01 | -0,005 | -0,005 | -0,02 |
| relative change | -0,16% | -0,17% | -4,05% | 0,00% | -5,62% | -8,08% | -8,55% | -8,55% | -0,17% |
For pollutant-specific information on recalculated emission estimates for Base Year and 2020, please see the recalculation tables following chapter 8.1 - Recalculations.
Uncertainties
Uncertainty estimates for activity data of mobile sources derive from research project FKZ 360 16 023: “Ermittlung der Unsicherheiten der mit den Modellen TREMOD und TREMOD-MM berechneten Luftschadstoffemissionen des landgebundenen Verkehrs in Deutschland” by Knörr et al. (2009) 8).
Uncertainty estimates for emission factors were compiled during the PAREST research project. Here, the final report has not yet been published.
Planned improvements
With respect to NFR 1.A.5.b as such, no overarching improvements are planned. For further information on possible sub-sector specific improvements, please follow the links above.


