meta data for this page
1.A.5.b i - Military Ground Vehicles and Vehicles
Short description
In sub-category 1.A.5.b i - Other, Mobile (including Military) emissions from military ground-vehicles and mobile machinery are reported.
| Method | AD | EF | Key Category Analysis |
|---|---|---|---|
| T1, T2 | NS | CS, D | see superordinate chapter |
Methodology
Activity data
Basically, all fuel consumption in military vehicles is included in the primary acitivity data provided by the National Energy Balances (NEB) (AGEB, 2022) 1).
As the NEB does not provide specific data for military use, the following additional sources are used:
For the years as of 1995, the official mineral-oil data of the Federal Republic of Germany (Amtliche Mineralöldaten der Bundesrepublik Deutschland), prepared by the Federal Office of Economics and Export Control (BAFA), are used (BAFA, 2022) 2). Provided in units of [1,000 t], these amounts have to be converted into [TJ] on the basis of the relevant net calorific values given by 3).
As the official mineral-oil data does not distinguish into fossil and biofuels but does provide amounts for inland deliveries of total diesel and gasoline fuels, no data on the consumption of biodiesel and bioethanol is available directly at the moment. Therefore, activity data for biofuels used in military vehicles are calculated by applying Germany's official annual biofuel shares to the named total deliveries (see also: info on EF).
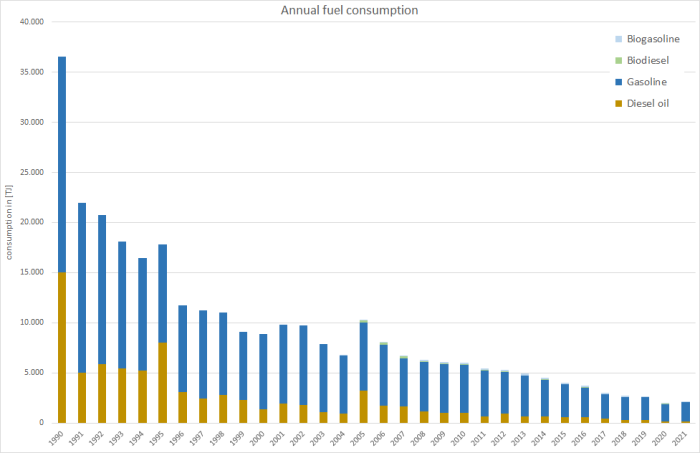
Table 1: Annual fuel deliveries to the military for ground-vehicles and machinery, in terajoules
| 1990 | 1995 | 2000 | 2005 | 2010 | 2011 | 2012 | 2013 | 2014 | 2015 | 2016 | 2017 | 2018 | 2019 | 2020 | 2021 | |
|---|---|---|---|---|---|---|---|---|---|---|---|---|---|---|---|---|
| Diesel Oil | 15,037 | 8,001 | 1,364 | 3,206 | 977 | 620 | 966 | 680 | 683 | 580 | 577 | 415 | 279 | 281 | 133 | 138 |
| Biodiesel | 21,508 | 9,800 | 7,477 | 6,838 | 4,792 | 4,624 | 4,106 | 4,027 | 3,635 | 3,287 | 2,959 | 2,463 | 2,300 | 2,269 | 1,770 | 1,921 |
| Gasoline | 0 | 0 | 0 | 214 | 74.9 | 43.2 | 68.2 | 40.3 | 41.9 | 31.7 | 30.6 | 22.1 | 16.2 | 16.0 | 11.1 | 9.55 |
| Biogasoline | 0 | 0 | 0 | 47.0 | 185 | 190 | 182 | 173 | 158 | 143 | 129 | 104 | 103 | 97.9 | 80.8 | 91.4 |
| Ʃ 1.A.5.b i | 36,545 | 17,801 | 8,841 | 10,306 | 6,029 | 5,476 | 5,323 | 4,920 | 4,517 | 4,041 | 3,696 | 3,004 | 2,699 | 2,663 | 1,995 | 2,160 |
Emission factors
Table 2: Annual country-specific emission factors1, in kg/TJ
| 1990 | 1995 | 2000 | 2005 | 2010 | 2011 | 2012 | 2013 | 2014 | 2015 | 2016 | 2017 | 2018 | 2019 | 2020 | 2021 | |
|---|---|---|---|---|---|---|---|---|---|---|---|---|---|---|---|---|
| DIESEL FUELS | ||||||||||||||||
| NH3 | 4.00 | 4.00 | 4.00 | 4.00 | 4.00 | 4.00 | 4.00 | 4.00 | 4.00 | 4.00 | 4.00 | 4.00 | 4.00 | 4.00 | 4.00 | 4.00 |
| NMVOC | 316 | 274 | 274 | 274 | 274 | 274 | 274 | 274 | 274 | 274 | 274 | 274 | 274 | 274 | 274 | 274 |
| NOx | 1,195 | 1,360 | 1,360 | 1,360 | 1,360 | 1,360 | 1,360 | 1,360 | 1,360 | 1,360 | 1,360 | 1,360 | 1,360 | 1,360 | 1,360 | 1,360 |
| SOx | 125 | 60.5 | 14.0 | 0.37 | 0.37 | 0.37 | 0.37 | 0.37 | 0.37 | 0.37 | 0.37 | 0.37 | 0.37 | 0.37 | 0.37 | 0.37 |
| PM2 | 53.0 | 53.0 | 53.0 | 53.0 | 53.0 | 53.0 | 53.0 | 53.0 | 53.0 | 53.0 | 53.0 | 53.0 | 53.0 | 53.0 | 53.0 | 53.0 |
| BC3 | 134 | 100 | 100 | 100 | 100 | 100 | 100 | 100 | 100 | 100 | 100 | 100 | 100 | 100 | 100 | 100 |
| CO | 515 | 350 | 350 | 350 | 350 | 350 | 350 | 350 | 350 | 350 | 350 | 350 | 350 | 350 | 350 | 350 |
| GASOLINE FUELS | ||||||||||||||||
| NH3 | 4.00 | 4.00 | 4.00 | 4.00 | 4.00 | 4.00 | 4.00 | 4.00 | 4.00 | 4.00 | 4.00 | 4.00 | 4.00 | 4.00 | 4.00 | 4.00 |
| NMVOC | 594 | 373 | 373 | 373 | 373 | 373 | 373 | 373 | 373 | 373 | 373 | 373 | 373 | 373 | 373 | 373 |
| NOx | 682 | 725 | 725 | 725 | 725 | 725 | 725 | 725 | 725 | 725 | 725 | 725 | 725 | 725 | 725 | 725 |
| SOx | 11.8 | 8.30 | 3.20 | 0.40 | 0.40 | 0.40 | 0.40 | 0.40 | 0.40 | 0.40 | 0.40 | 0.40 | 0.40 | 0.40 | 0.40 | 0.40 |
| PM2 | 3.63 | 3.55 | 3.13 | 2.66 | 2.14 | 2.09 | 2.03 | 1.97 | 1.91 | 1.91 | 1.91 | 1.91 | 1.91 | 1.91 | 1.91 | 1.91 |
| BC3 | 0.44 | 0.43 | 0.38 | 0.32 | 0.26 | 0.25 | 0.24 | 0.24 | 0.23 | 0.23 | 0.23 | 0.23 | 0.23 | 0.23 | 0.23 | 0.23 |
| CO | 4,199 | 4,010 | 4,010 | 4,010 | 4,010 | 4,010 | 4,010 | 4,010 | 4,010 | 4,010 | 4,010 | 4,010 | 4,010 | 4,010 | 4,010 | 4,010 |
| TSP4 | 2.46 | 0.82 | ||||||||||||||
| Pb4 | 1.54 | 0.52 | ||||||||||||||
1 Due to lack of better information: similar EF are applied for fossil fuels and biofuels.
2 EF(PM2.5) also applied for PM10 and TSP (assumption: > 99% of TSP from diesel oil combustion consists of PM2.5)
3 EF(BC) estimated from tier1 default f-BC values provided in 4), chapter 1.A.3.b, table 3-11 for gasoline passenger cars (f-BC: 0.12) and diesel heavy duty vehicles (f-BC: 0.53)
4 from leaded gasoline (until 1997), based upon country-specific emission factors from TREMOD 5)
With respect to the emission factors applied for particulate matter, given the circumstances during test-bench measurements, condensables are most likely included at least partly. 1)
For information on the emission factors for heavy-metal and POP exhaust emissions, please refer to Appendix 2.3 - Heavy Metal (HM) exhaust emissions from mobile sources and Appendix 2.4 - Persistent Organic Pollutant (POP) exhaust emissions from mobile sources.
Discussion of emission trends
As only NFR 1.A.5.b as a whole is taken into account within the key category analysis, this country-specific sub-sector is not considered separately.
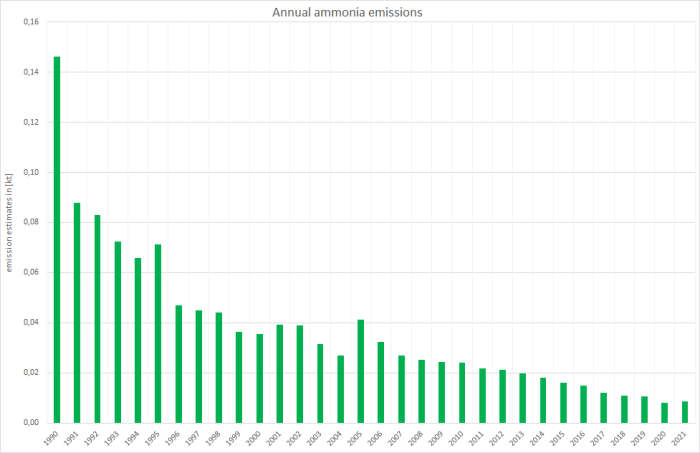
Due to the application of very several tier1 emission factors, most emission trends reported for this sub-category only reflect the trend in fuel deliveries. Therefore, the fuel-consumption dependend trends in emission estimates are only influenced by the annual fuel mix.
Here, diesel oil deliveries data show a peak in 2005 resulting in emission estimates well above the values of previous and following years. Due to the applied approach, the resulting outliers especially for NOx and PM emissions have already been looked into in several NEC and CLRTAP Reviews. However, given the underlying activity data, the noticeable emission estimates cannot be revised in a sensible way.
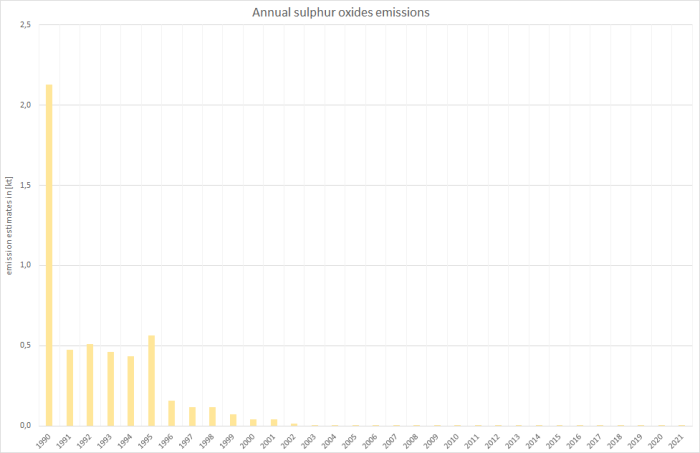
Here, for sulphur dioxide, this consumption-based falling trend is intensified by the impact of fuel-sulphur legislation.
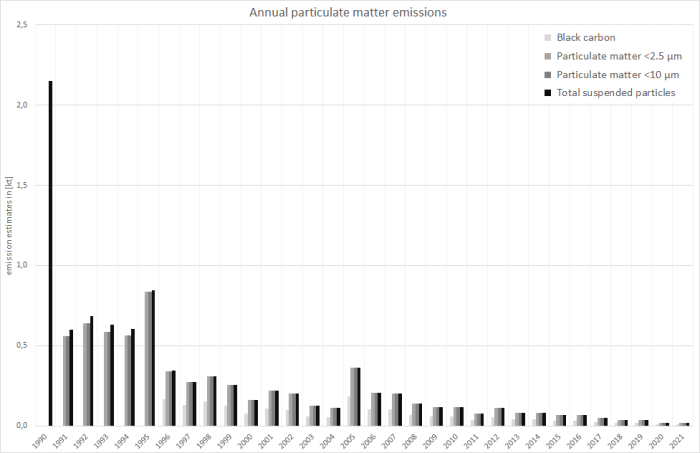
Over-all particulate matter emissions are dominated by emissions from diesel oil combustion with the falling trend basically following the decline in fuel consumption. Here, until 1997, the emission values reported for total suspended particles (TSP) are slightly higher than those reported for PM2.5 and PM10 due to the additional TSP emissions from leaded gasoline that was banned in 1997.
Regarding the peak in PM emissions 2005: The dominating source of particulate matter (and NOx) emissions is the use of diesel oil in militar ground vehicles and machinery as well as military vessels. Here, the underlying activity data (annual diesel oil inland deliveries) for 2005 are well above the values of previous and following years but cannot be revised in a sensible way.
Recalculations
For information on revised inventory data, please see the superordinate chapter.
Planned improvements
Given the limited quality of the emission factors applied, the inventory compiler will check a possible revision at least for the main pollutants.


