meta data for this page
Appendix 5 - Verification with Independent Data
5.1 Introduction
Four independent datasets were used for the verification work for the German Informative Inventory Report (IIR). The selection of these verification data were carried out on the basis of broadly accepted, independent data similar to the good guidelines for verification in the 2019 refinements of the IPCC guidelines for verification (Romano et al., 2019)1). The first recommended dataset is the air-pollution (AP) dataset of the Emission Database for Global Atmospheric Research (EDGAR) of the JRC (Crippa et al., 2019)2), which is a worldwide gold standard source of data for global and local air-quality modelling. It contains standard air-pollutants, such as NO2 or NMVOC. Data for several heavy metals species are, however, missing in this dataset. The second source of data is the mass median data for the German data from the European moss survey (Schröder and Nickel, 2019)3), which is also part of the monitoring carried out at the Umweltbundesamt in Germany. Here the median of the mass fraction in moss for each heavy metal species is compared to the reported inventory data. The third dataset used is the Pollution Release and Transfer Register (PRTR) (Umweltbundesamt, 2022)4). Details for the PRTR data, as well as the database may be found under: https://thru.de/thrude/. Here analysis has been split into two parts, first the heavy metal air-pollutants and secondly the ordinary air-pollutants, due to their different mass in the reporting tables. The most important, modern dataset used in the verification work is available via the Copernicus Atmospheric Monitoring Service, Atmospheric Datastore (CAMS-ADS), which are the CAMS global reanalysis (EAC4) monthly averaged field (ECMWF, 2022)5). Details of these dataset are detailed in (Inness et al., 2019)6). These data provide monthly averaged fields for standard air-pollutants such as NO₂, or particulate matter. Data for more insight into the distribution of heavy metal species are, however, missing. Time series data from all the four datasets are compared to the reported national inventory data time series on the basis of the national totals for Germany. This is done in a visual-quantitative way using plots of the time series data of the national totals, as well as scatter plots between the reported national totals and each of the four sets of data. In addition a quantitative analysis in form of correlation is carried out using standard mathematical similarity operators such as the Pearson and Spearman-Rank correlations, which are widely used to compute similarity between two mathematical vectors. The overall goal is to offer a semi-quantitative and qualitative comparison between the reported national totals of air pollution species and the independent datasets using time-series data. A direct sector-based comparison has not been considered, yet, as only EDGAR and PRTR data would offer a sectoral disaggregation of the national total data.
5.2 Methods and Materials
Each of the four datasets require separate analysis using specialized python scripts, that have been developed for this verification work. The EDGAR spreadsheet data was used for the extraction of the EDGAR-AP national totals for Germany (Crippa et al., 2019)7). PRTR data were used in form of an sql-database file, which offers all the national reported data on large point sources (Umweltbundesamt, 2022)8). CAMS data from the European Centre for Medium-Range Weather Forecasts (ECMWF) were used, which are available in monthly slices in netcdf-Format (Inness et al., 2019)9). Data from the German part of the European moss survey (Schröder et al., 2019))10) was kindly provided by Gudrun Schütze from the Umweltbundesamt.
5.2.1 The EDGAR AP Inventory
EDGAR Inventory Data and its database (Crippa et al., 2019)11) are available from the Joint Research Center (JRC) of the European Commission. We used the version 5.0 air-pollution database, which offers annual totals of major air pollutants, as well as gridded emissions, for air pollution modelling. National totals of air-pollutants (AP) were extracted from the EDGAR spreadsheets for verification. The air-pollutants offered in the database are NO2, PM10, PM2.5, SO2, CO, BC, NMVOC and NH3. The current EDGAR timeseries (Crippa et al., 2019)12) covers the time period from 1970 until 2015. The EDGAR AP inventory is frequently update on a longer product cycle.
5.2.2 The CAMS EAC4 data
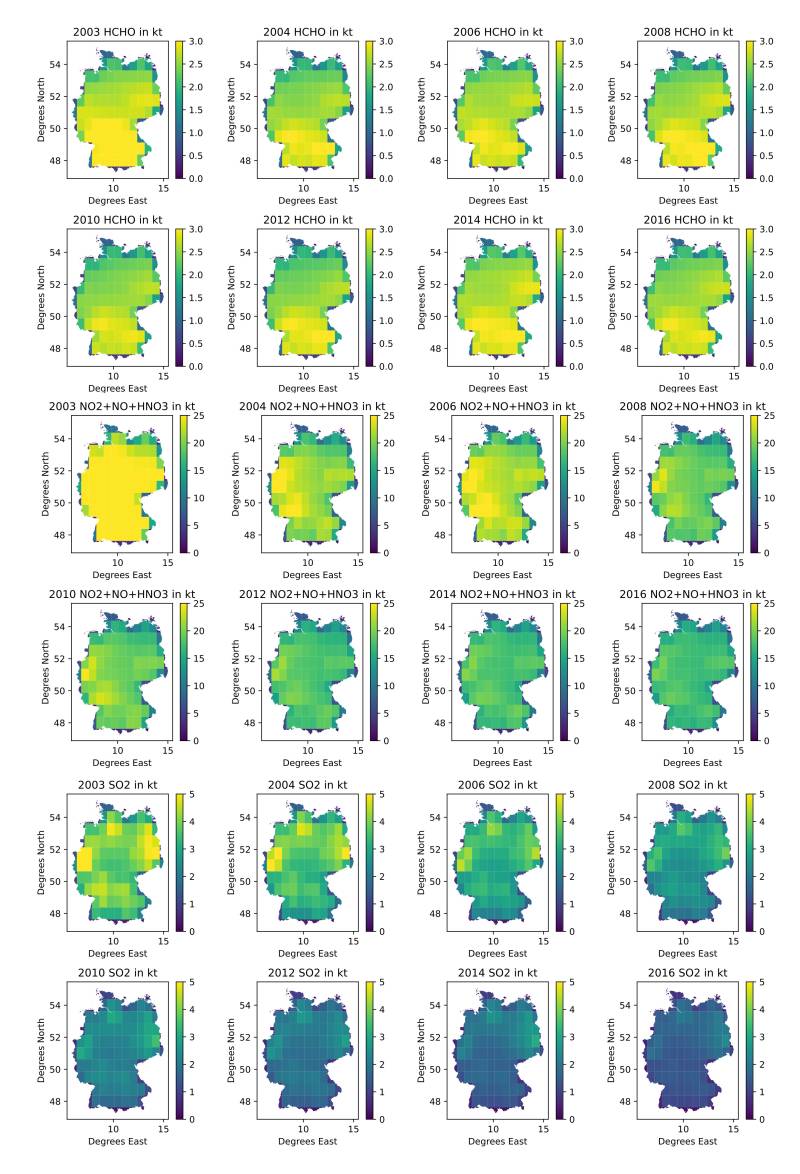
The CAMS global reanalysis data products are available from the ECMWF Atmospheric Composition Reanalysis (EAC4) process. They are available as either daily or monthly (ECMWF, 2022)13) data products in either single, or multi-level variants. More detail on the data products and their generation can be found in (Inness et al., 2019)14). For the verification work presented here the 0.75°x0.75° monthly averaged fields data product was used, which is available for the time-period from 2003 till 06/2021. Therefore, we used the time-period from 2003 until 2020 for comparison to the German inventory data. The update frequency of this monthly dataset is every six months, carried out by the ECMWF. The CAMS monthly dataset offers total column values for the following major air-pollutants (PM10, PM2.5, NO2, SO2 and several species of NMVOC such as HCHO), which were used in the following for a comparison to the national total values for Germany. An example of the monthly data aggregated to the respective year can be seen in figure 1.
5.2.3 The Pollution Release and Transfer Register
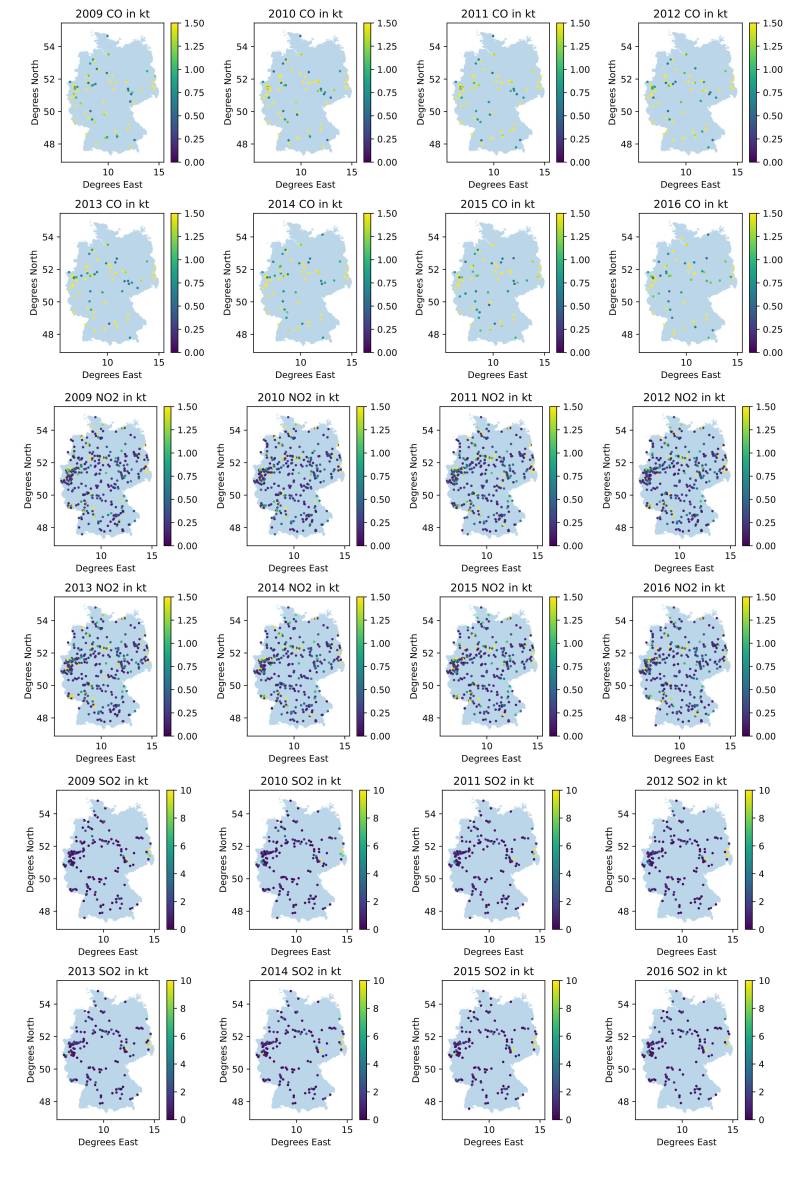
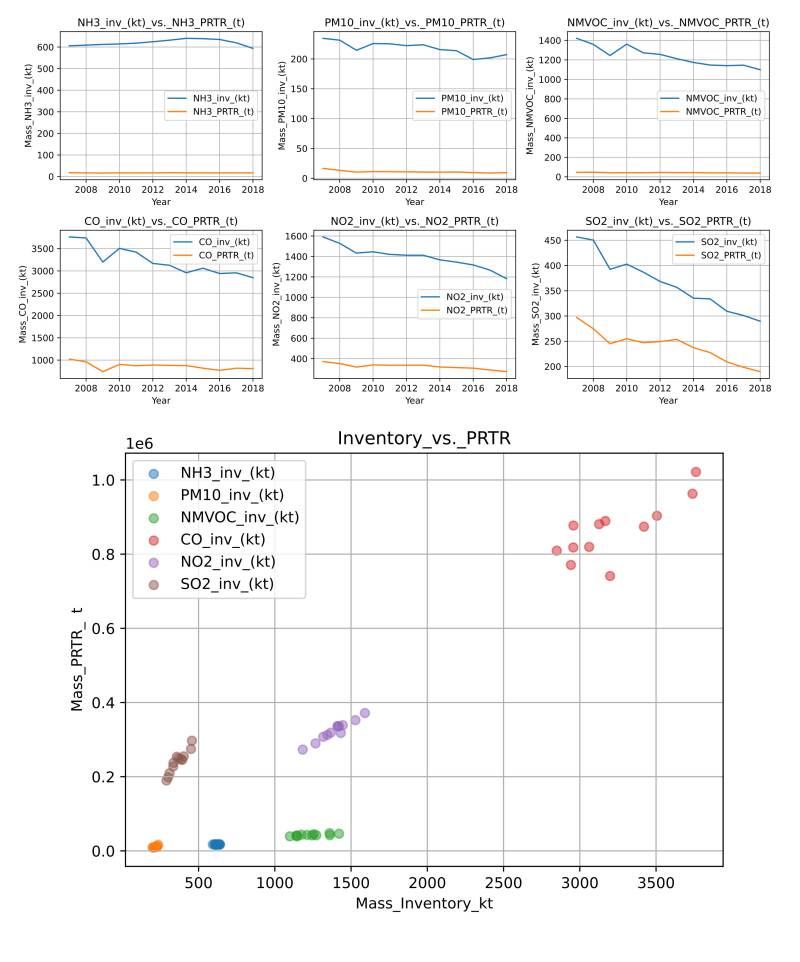
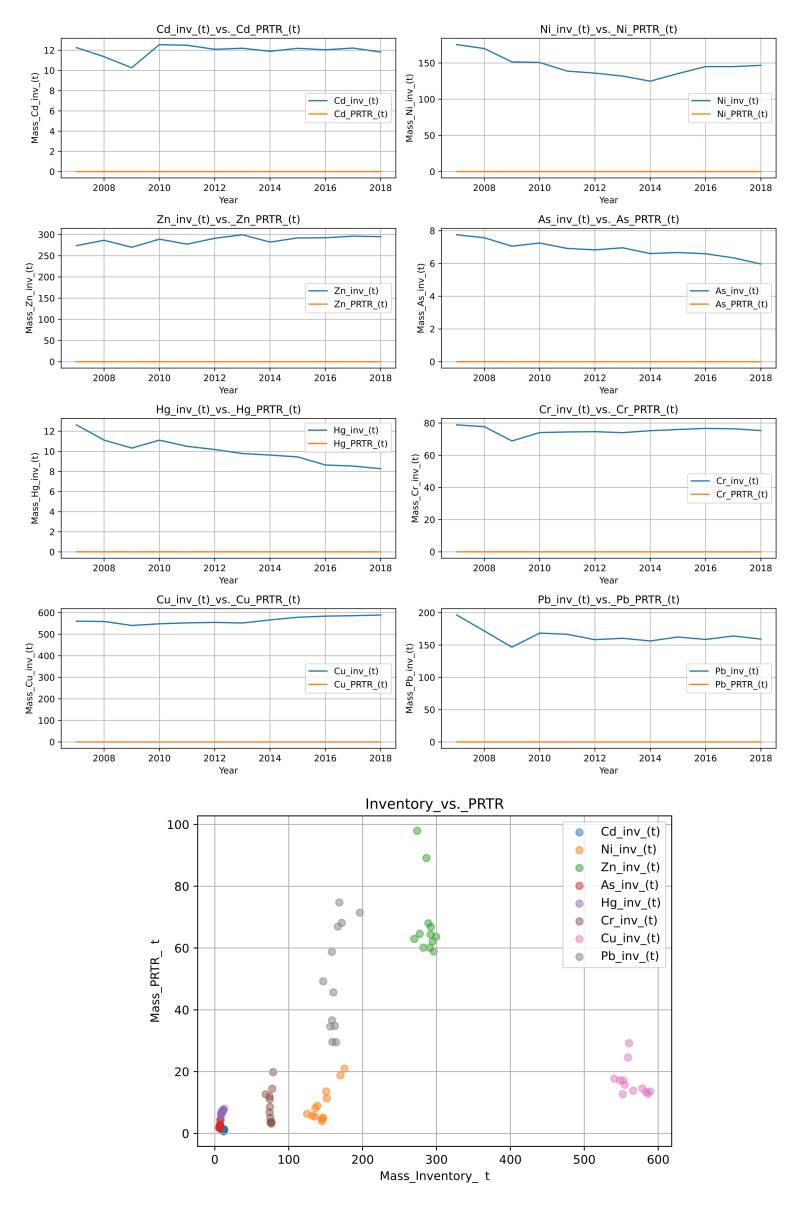
The PRTR database is an SQL-Database file, which is available for download at the domain thru.de. The data is compiled and curated by the Umweltbundesamt in Germany. It compiles data, which are reported for the large emission sources in Germany, which are e.g.: power plants, smelters, or plants from the chemical industry. The European Union Regulation No 166/2006 on the establishment of a PRTR register governs the process of PRTR data compilation. A modified Python script was used, to extract data from the PRTR database. The tool is based on the PRTR reporting tool of (Hausmann, Zagorski and Mielke, 2021)15). Figure 2 shows the data of PRTR point sources extracted from the PRTR database file for visualization. We used the PRTR data from 2007 till 2018 for our verification work for the air pollutants: CO, NO2, SO2, NMVOC, PM10 and NH3. Data from the heavy-metals species: Cd, Ni, Zn, As, Hg, Cr, Cu and Pb were also used for the here presented verification work of the national totals of Germany.
5.2.4 The German Moss Survey Data
Data from the German Moss survey, which is carried out within the larger context of the European moss survey (Frontasyeva et al. 2020)16); (Schröder et al., 2019)17) is also used for verification of the temporal trend of heavy metals in the German inventory. This survey is carried out every 5 years. It has been conducted since 1990. The time series for Germany currently covers 1990, 1995, 2000, 2005 and 2015. The data is sampled in a specified grid following a specific methodology detailed in (Schröder and Nickel, 2019)18) and (Schröder et al., 2019)19).
5.3 Analysis
The analysis of the data for the national totals is carried out on the available time-series/air-pollutant species data, as offered by the four datasets. Therefore, the temporal resolution and series length is dependant on the verification data offered. Only those timestamps matching, with the reported national totals for Germany could be compared. Figure 1 and figure 2 are visual examples of the CAMS and PRTR data of Germany, to illustrate the spatial distribution of the data. Pearson and the spearman-rank correlation were computed for each, individual time-series pair (verification data and reported national total). These standard similarity measures were computed, to quantify the similarity between the temporal trends of the individual air-pollutant dataset.
5.3.1 The EDGAR AP Inventory
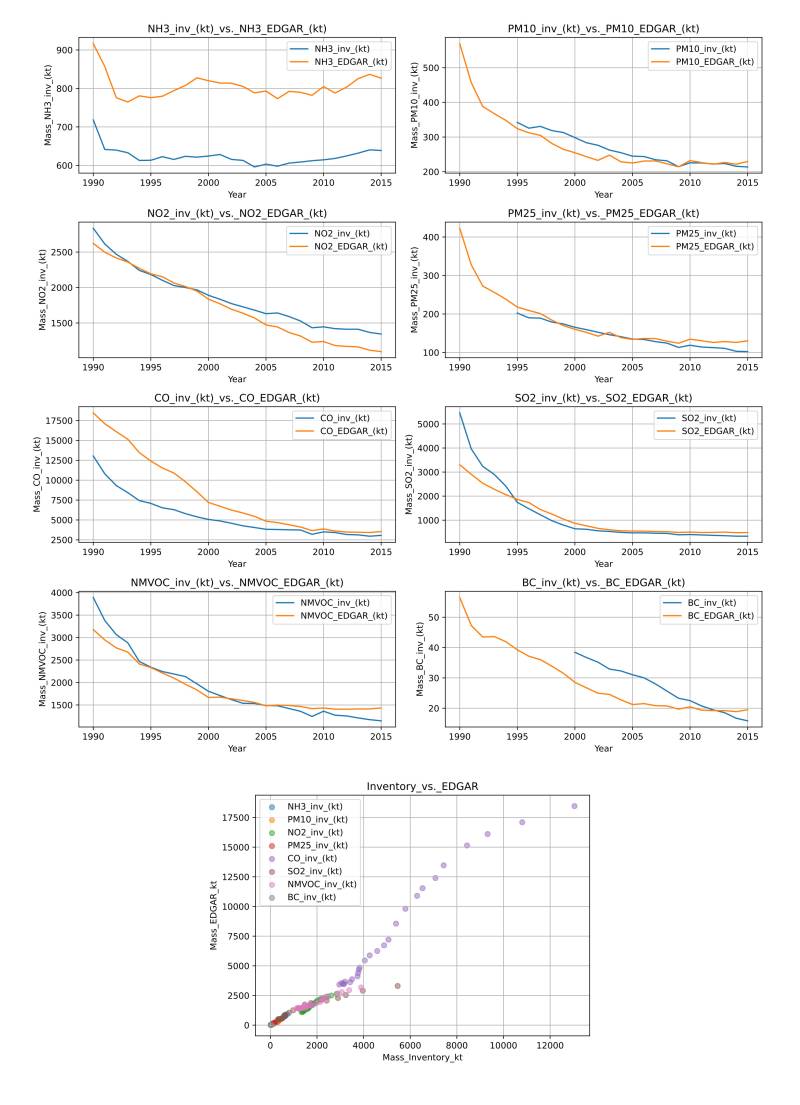
EDGAR data was extracted from the national totals spread-sheets, offered as download from the JRC (Crippa et al., 2019)20) using python scripts. The national totals for Germany were extracted as individual time series for the respective air pollutants (NO2, PM10, PM2.5, SO2, CO, BC, NMVOC and NH3). The EDGAR data for the eight AP species and a scatter plot are shown in figure 3. The orange line depicts the time series from the EDGAR national total, whilst the blue line illustrates the national total from the German inventory, together with a scatterplot of all eight individual AP species.
5.3.2 The CAMS EAC4 Data
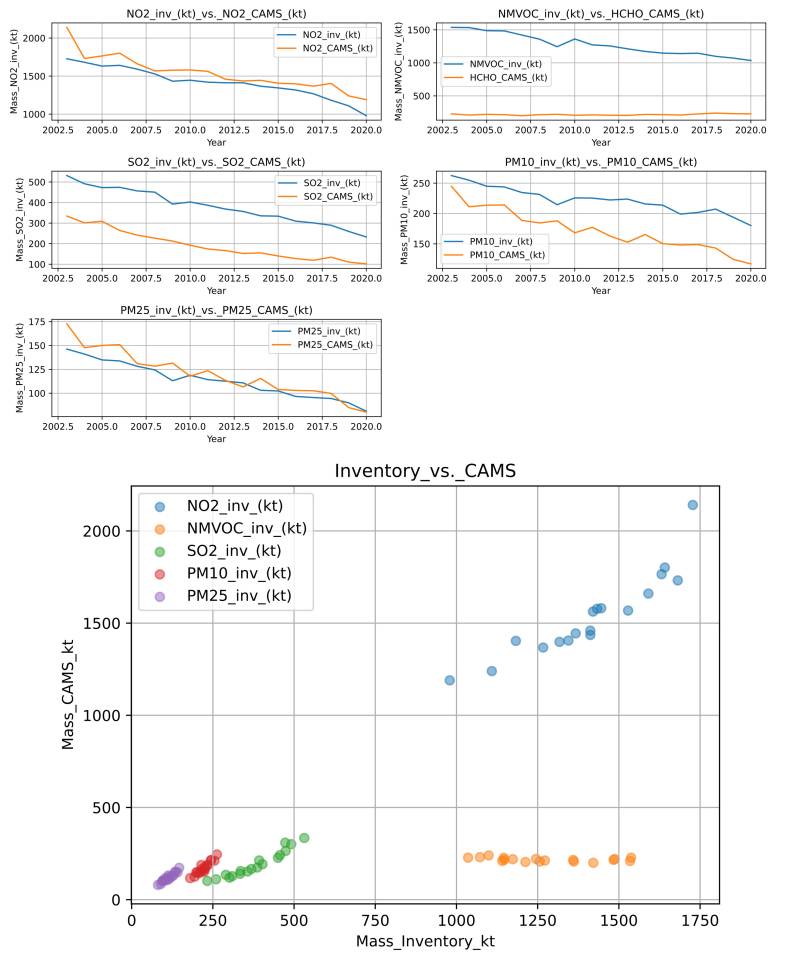
The monthly averaged CAMS EAC4 data has been aggregated to the spatial scale of Germany with the help of a spatial vector data file, which symbolizes the country area of Germany (Patterson and Kelso, 2022)21). It has been intersected with the CAMS EAC4 data, enabling the cropping of the data pixels to the shape of Germany. The equal earth projection of (Šavrič, Patterson and Jenny, 2019)22) was used after this procedure to calculate the area of each cell in-order to convert the CAMS EAC4 field data to mass per pixel and month. These monthly time slices were summed up for all twelve months to retrieve the national total for the respective AP species of each year. The data is shown in figure 4.
5.3.3 The Pollution Release and Transfer Register
The PRTR database is an SQL-Database file, which is available for download at the domain thru.de. The data is compiled and curated by the Umweltbundesamt in Germany. It compiles data, which are reported for the large emission sources in Germany, which are e.g.: power plants, smelters, or plants from the chemical industry. The European Union Regulation No 166/2006 on the establishment of a PRTR register governs the process of PRTR data compilation. A modified Python script was used, to extract data from the PRTR database. The tool is based on the PRTR reporting tool of (Hausmann, Zagorski and Mielke, 2021)23). Figure 2 shows the data of PRTR point sources extracted from the PRTR database file for visualization. We used the PRTR data from 2007 till 2018 for our verification work for the air pollutants: CO, NO2, SO2, NMVOC, PM10 and NH3. Data from the heavy-metals species: Cd, Ni, Zn, As, Hg, Cr, Cu and Pb were also used for the here presented verification work of the national totals of Germany.
5.3.4 The German Moss Survey Data
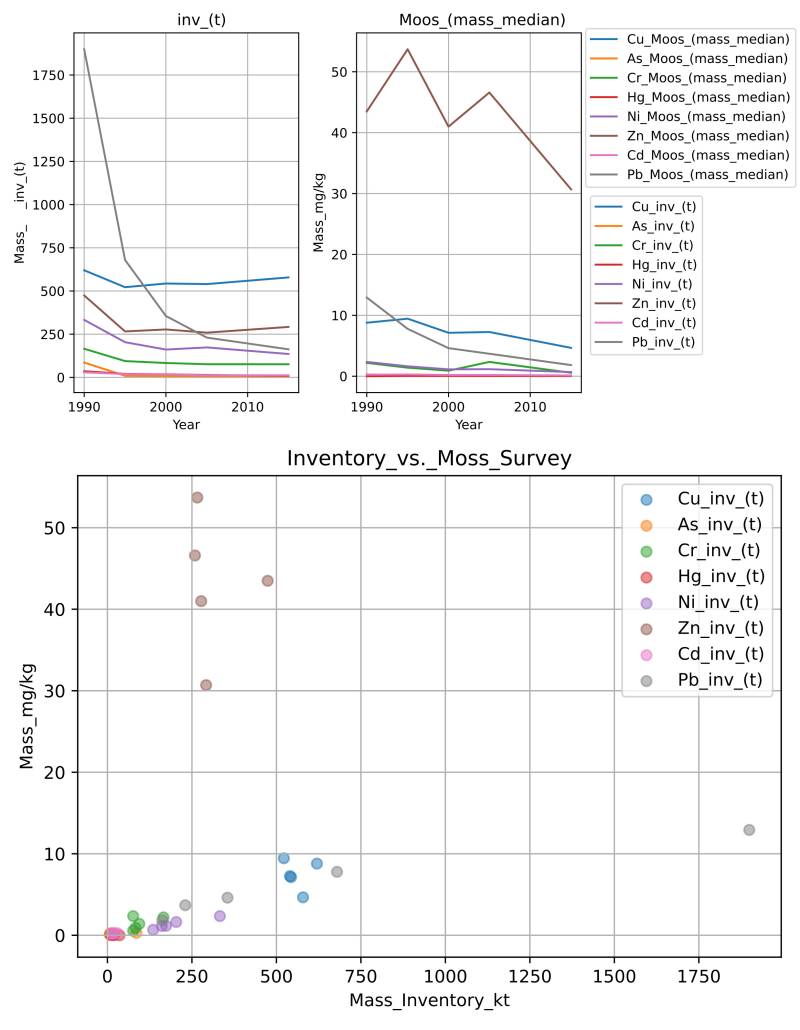
Data from the German Moss survey, which is carried out within the larger context of the European moss survey (Frontasyeva et al. 2020; Schröder et al., 2019) is also used for verification of the temporal trend of heavy metals in the German inventory. This survey is carried out every 5 years. It has been conducted since 1990. The time series for Germany currently covers 1990, 1995, 2000, 2005 and 2015. The data is sampled in a specified grid following a specific methodology detailed in (Schröder and Nickel, 2019)24) and (Schröder et al., 2019)25). Here the median for each heavy metal species per year was calcluated and compared to the reported heavy metal emission value of that year as shown below in figure 7.
5.4 Results and Discussion
The trend data in figures 3-7 show an overall good agreement of the national totals from the verification data with the national inventory data in the time series, as well as scatter plots. Individual differences in the four datasets for specific air-pollutants are discussed below.
5.4.1 The EDGAR Inventory
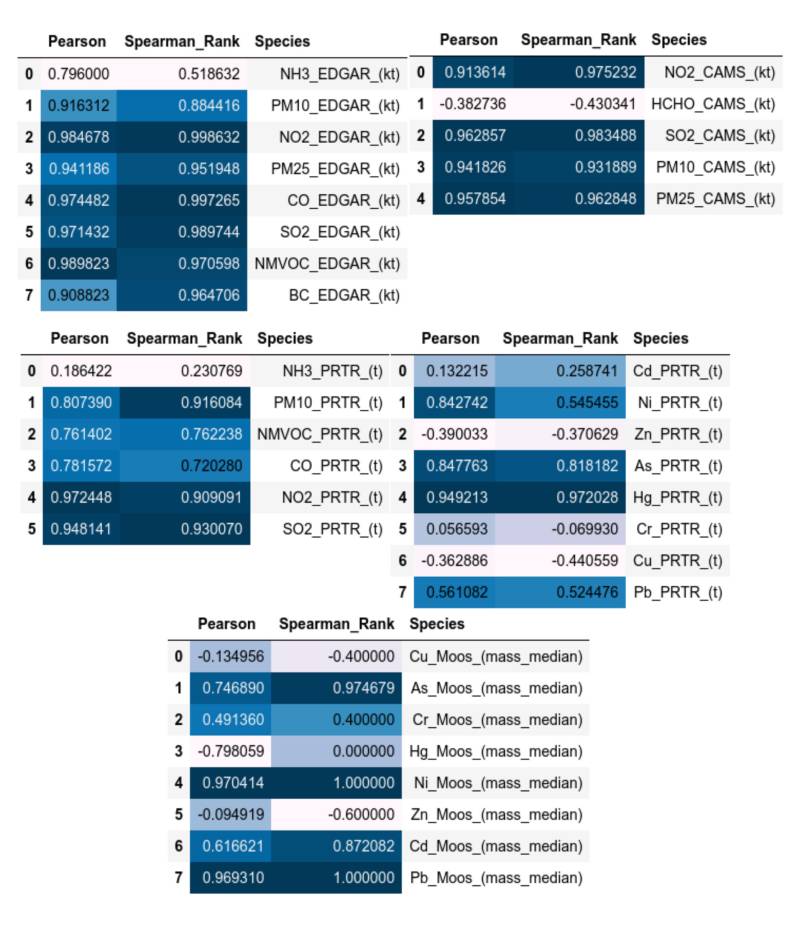
The EDGAR inventory usually is in good agreement with the national inventory data as shown in figure figure 3. Close, almost perfect matches of the EDGAR national totals with the reported inventory data can be found in case of SO2, NMVOC, NO2, PM2.5 and PM10. Slight deviations with a convergence around 2015 exist for CO and black carbon. Ammonia data from EDGAR are considerably higher than the reported national totals (~200kt difference). This needs to be further investigated in future disaggregated, detailed analysis, which is not offered in this report, yet. The scatterplot shows similar exceptional correlations between the EDGAR data and the reported national totals of Germany as shown in the lowermost figure of figure 3. The correlation values for the individual time series of the EDGAR data towards the inventory data can be found in figure 8. Here correlation values are relatively high above 0.8-0.9 with the already discussed exception of the ammonia data, as shown in figure 3.
5.4.2 The CAMS EAC4 Data
The CAMS EAC4 data shows very high correlation values to the reported national totals as shown in figure 8., all correlation values are above 0.9 with the exception of formaldehyde (HCHO). The low values here for formaldehyde are compared to the much higher national total values for NMVOC. This shows that formaldehyde on its own is not a sufficient proxy for NMVOC in case of Germany. PM2.5 and PM10 values of the EAC4 data show a good agreement to the national totals of Germany as shown in figure figure 4. The higher values of the CAMS NO2 data and the reported NO2 data in the inventory are due to the fact that the here shown CAMS NO2 (ECMWF, 2022)26) data has been compiled as the sum of the total columns of the CAMS EAC4 NO, NO2 and HNO3 data product. The NO2 data alone or even the sum of all NOx total column products would yield significantly lower values as reported in the national totals of Germany. Only the sum of all NOx related chemical species yields a value, which is close to the reported national totals of the inventory.
5.4.3 The Pollution Release and Transfer Register
Data for PM10, NO2 and SO2 are well correlated with the reported emissions with correlation values above 0.9 as shown in figure 8. This is also shown in the scatterplots and trend diagrams of figure 5. NMVOC and CO show moderate correlation values above 0.7, whilst ammonia data shows almost no correlation. For the heavy metals As and Hg correlation values above 0.8 are shown in figure 8, whilst only moderate correlation values exist for Pb and Ni (around 0.5), whilst Cu, Cr, Zn and Ni show almost no correlation, which is also visible in the scatter plot of figure 6.
5.4.4 The German Moss Survey Data
The moss survey data shows exceptional high correlation values (above 0.97) for As, Ni and Pb, as illustrated in figure 8, whilst data for Cd shows only values around 0.87. All other correlation values are considerably lower. Figure 7 shows the similar picture in the accompanying scatterplot.

