meta data for this page
1.B.2.a - Oil
| Category Code | Method | AD | EF | ||||||||||||
|---|---|---|---|---|---|---|---|---|---|---|---|---|---|---|---|
| 1.B.2.a.i | T2 | AS | CS | ||||||||||||
| 1.B.2.a.iv | T2 | AS | CS | ||||||||||||
| 1.B.2.a.v | T2 | AS | CS | ||||||||||||
| Key Category | NOx | NMVOC | SO2 | NH3 | PM2_5 | PM10 | TSP | BC | CO | PB | Cd | Hg | Diox | PAH | HCB |
|---|---|---|---|---|---|---|---|---|---|---|---|---|---|---|---|
| 1.B.2.a.i | - | -/- | - | - | - | - | - | - | - | - | - | - | - | - | - |
| 1.B.2.a.iv | -/- | -/- | -/- | - | - | - | - | - | -/- | - | - | - | - | - | - |
| 1.B.2.a.v | - | -/T | - | - | - | - | - | - | - | - | - | - | - | - | - |
.
1.B.2.a.i - Exploration, production, transport
Emissions from exploration consist of emissions from activities of drilling companies and other actors in the exploration sector. Gas and oil exploration takes place in Germany. According to the BVEG (former WEG) 1), virtually no fugitive emissions occur in connection with drilling operations, since relevant measurements are regularly carried out at well sites (with use of methane sensors in wellhead-protection structures, ultrasound measurements and annulus manometers) and old / decommissioned wells are backfilled and normally covered with concrete caps.
Table 1: Activity data applied for emissions from oil exploration
| Unit | 1990 | 1995 | 2000 | 2005 | 2010 | 2015 | 2019 | 2020 | |
|---|---|---|---|---|---|---|---|---|---|
| number of wells | No. | 12 | 17 | 15 | 23 | 16 | 18 | 26 | 12 |
| total of drilling meter | m | 50,140 | 109,187 | 41,378 | 63,994 | 51,411 | 32,773 | 43,416 | 6,220 |
Since pertinent measurements are not available for the individual wells involved, a conservative approach is used whereby VOC emissions for wells are calculated on the basis of the share ratio of VOC = 9 NMVOC : 1 CH4, using the default methane factor of the IPCC Guidelines 2006 2).
Table 2: NMVOC emission factor applied for emissions from oil exploration, in [kg/No.]
| Value |
|---|
| 576 |
Emissions from extraction (crude oil) and first treatment of raw materials (petroleum) in the petroleum industry are included in 1.B.2.a.i as well. Because Germany's oil fields are old, oil production in Germany is highly energy-intensive (thermal extraction, operation of pumps to inject water into oil-bearing layers). The first treatment that extracted petroleum (crude oil) undergoes in processing facilities serves the purpose of removing gases, water and salt from the oil. Crude oil in the form present at wellheads contains impurities, gases and water and thus, does not conform to requirements for safe, easy transport in pipelines. No substance transformations take place. Impurities – especially gases (petroleum gas), salts and water – are removed in order to yield crude oil of suitable quality for transport in pipelines.
Table 3: Annual amounts of oil produced, in [kt]
| 1990 | 1995 | 2000 | 2005 | 2010 | 2015 | 2019 | 2020 |
|---|---|---|---|---|---|---|---|
| 3,606 | 2,959 | 3,123 | 3,573 | 2,516 | 2,414 | 1,927 | 1,907 |
The emissions from production and processing are measured or calculated by the operators, and the pertinent data is published in the annual reports of the Federal association of the natural gas, oil and geothermal energy industries (BVEG) 3). The emission factors are determined from the reported emissions and the activity data.
Table 4: NMVOC emission factor applied for emissions from oil exploration, in [kg/m³]
| Value |
|---|
| 0.015 |
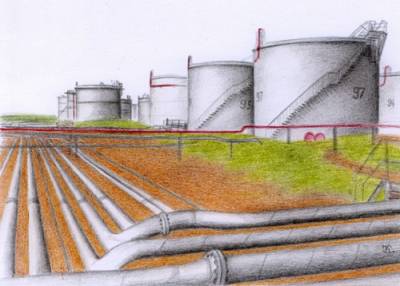
Transport emissions are tied to activities of logistics companies and of pipeline operators and pipeline networks. After the first treatment, crude oil is transported to refineries. Almost all transport of crude oil takes place via pipelines. Pipelines are stationary and, normally, run underground. In contrast to other types of transport, petroleum transport is not interrupted by handling processes.
Table 5: Activity data applied for emissions from oil transportation, in [kt]
| Activity | 1990 | 1995 | 2000 | 2005 | 2010 | 2015 | 2019 | 2020 |
|---|---|---|---|---|---|---|---|---|
| Transport of domestically produced crude oil | 3,660 | 2,940 | 3,123 | 3,572 | 2,516 | 2,414 | 1,927 | 1,907 |
| Transport of imported crude oil | 84,043 | 86,063 | 89,280 | 97,474 | 93,270 | 91,275 | 85,991 | 83,049 |
| Transport via inland-waterway tankers | 89 | 67 | 112 | 176 | 6 | 43 | 47 | 46 |
For pipelines, the emission factor for inland-waterway tankers has been estimated by experts. The pertinent emission factors have been confirmed by the research project “Determination of emission factors and activity data in areas 1.B.2.a.i through vi” 4). Since long-distance pipelines are continually monitored and disruptive incidents in such pipelines are very rare 5), emissions occur – in small quantities – only at their transfer points. The emission factor is thus highly conservative. The emission factor covers the areas of transfer / injection into pipelines at pumping stations, all infrastructure along pipelines (connections, control units, measuring devices), and transfer at refineries, and it has been determined on the basis of conservative assumptions. For imported quantities, only one transfer point (the withdrawal station) is assumed, since the station for input into the pipeline network does not lie on Germany's national territory.
Table 6: NMVOC emission factor applied for emissions from oil transportation, in [kg/t]
| Activity | Value |
|---|---|
| Transports of domestically produced crude oil | 0.13 |
| Transports of imported crude oil | 0.064 |
| Transports via inland-waterway tankers | 0.34 |
1.B.2.a.iv- Refining / storage
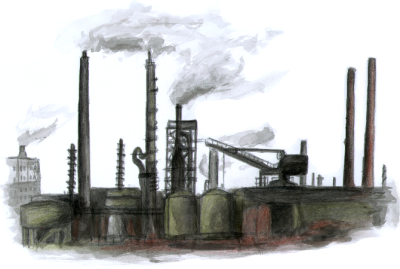
Emissions in category 1.B.2.a.iv - Refining / storage consist of emissions from activities of refineries and of refining companies in the petroleum industry. Crude oil and intermediate petroleum products are processed in Germany. For the most part, the companies concerned receive crude oil for refining and processing. To some extent, intermediate petroleum products undergo further processing outside of refineries in processing networks. Such processing takes place in state-of-the-art plants.
Refinery tank storage systems are used to store both crude oil and intermediate and finished petroleum products. They thus differ from non-refinery tank storage systems in terms of both the products they store and the quantities they handle. Tank-storage facilities outside of refineries are used especially for interim storage of heating oil, gasoline and diesel fuel. The storage capacities of storage caverns for petroleum products are listed separately. In light of the ways in which storage caverns are structured, it may be assumed that no emissions of volatile compounds occur. This is taken into account in the emissions calculation.
Tanks are emptied and cleaned routinely before tank inspections and repairs. In tank cleaning, a distinction is made between crude-oil tanks and product tanks. Because sediments accumulate in crude oil tanks, cleaning these tanks, in comparison to cleaning product tanks, is a considerably more laborious process. The substances in product tanks produce no sediments and thus are cleaned only when the products they contain are changed. In keeping with an assessment of Müller-BBM (2010)6), the emission factors for storage of crude oil and of petroleum products may be assumed to take the cleaning processes into account.
Table 8: Activity data applied for emissions from oil refinement and storage
| Activity | unit | 1990 | 1995 | 2000 | 2005 | 2010 | 2015 | 2019 | 2020 |
|---|---|---|---|---|---|---|---|---|---|
| Quantity of crude oil refined | kt | 107,058 | 96,475 | 107,632 | 114,589 | 95,378 | 93,391 | 87,013 | 83,990 |
| Capacity utilisation in refineries | % | 106 | 92 | 95 | 99 | 81 | 91 | 85 | 85 |
| Crude-oil-refining capacity in refineries | kt | 100,765 | 104,750 | 112,940 | 115,630 | 117,630 | 103,080 | 102,655 | 105,655 |
| Tank-storage capacity in refineries and pipeline terminals | Mill m³ | 27,1 | 28,4 | 24,9 | 24 | 22,5 | 22 | 20,7 | 20,7 |
| Storage capacity of tank-storage facilities outside of refineries | Mill m³ | 15,4 | 15,9 | 18,1 | 17 | 15,9 | 15,3 | 15,4 | 15,3 |
| Storage capacity of caverns | Mill m³ | 26,6 | 25,3 | 27,9 | 27,2 | 27,2 | 25,5 | 26,7 | 25,5 |
Processing The emission factors used for NMVOC, CO, NOₓ and SO₂ were determined by evaluating the emission declarations of the period 2004 through 2016 in the framework of a research project (Bender & von Müller, 2019) 7).
Tank-storage facilities in refineries
In keeping with the results of the research project “Processing of data of emissions declarations pursuant to the 11th Ordinance Implementing the Federal Immission Control Act – the area of storage facilities” (Müller-BBM, 2010) 8), the crude-oil-distillation capacity is used as the activity data for estimating emissions from storage in refineries. The fugitive VOC emissions value specified in the VDI Guideline 2440 9), 0.16 kg/t, may be used as the emission factor. The EF for methane was derived from it (5-10 % of 0.16 kg) and then suitably deducted.
Tank-storage facilities outside of refineries
According to Müller-BBM (2010) 10), no emission factors could be derived by evaluating emission declarations for storage systems, which would be representative of individual systems. This is due, according to the same source, to the widely differing emission behaviours of different individual systems. It was possible, however, to form aggregated emission factors. For each relevant group of data, this was done by correlating the sums of all emissions with the sums of all capacities. For non-refinery tank-storage systems, storage of liquid petroleum products can be differentiated from storage of gaseous petroleum products, since the relevant data is suitably differentiated.
Claus plants
The emission factors used for NMVOC, CO, NOₓ und SO₂ were determined by evaluating emission declarations from refineries for the period 2004 through 2016, in the framework of a research project (Bender & von Müller, 2019)11). Since no data was available for earlier years, the data obtained this way was used for all years as of 1990.
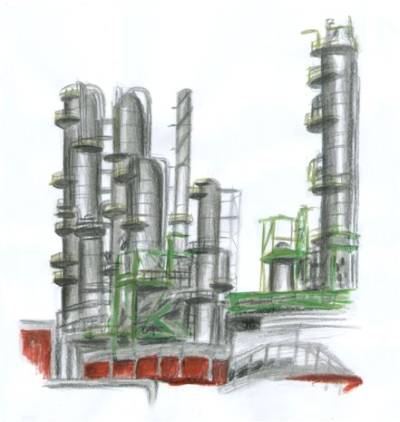
Table 9: Emission factors applied for emissions from oil refinement and storage
| Activity | Substance | Unit | Value |
|---|---|---|---|
| Fugitive emissions at refineries | NMVOC | kg/t | 0.0072 |
| Fugitive emissions at refineries | NOₓ | kg/t | 0.00602 |
| Fugitive emissions at refineries | SO₂ | kg/t | 0.00085 |
| Fugitive emissions at refineries | CO | kg/t | 0.000494 |
| Storage and cleaning of crude oil in tank-storage facilities of refineries | NMVOC | kg/t | 0.0227 |
| Storage of liquid petroleum products in tank-storage facilities outside of refineries | NMVOC | g/m³ | 100 |
| Storage of gaseous petroleum products in tank-storage facilities outside of refineries | NMVOC | g/m³ | 500 |
| Claus Plants | NMVOC | kg/t | 0.000025 |
| Claus Plants | NOₓ | kg/t | 0.0022 |
| Claus Plants | SO₂ | kg/t | 0.048 |
| Claus Plants | CO | kg/t | 0.0036 |
Emissions from storage consider all refinery products. According to the EMEP guidebook, fuel-related emissions are reported under 1.B.2. Emissions other than fuels (like naphtha, methanol etc.) are reported under 2.B.10.b - Storage, Handling and Transport of Chemical Products.
1.B.2.a.v- Distribution of oil products
In category 1.B.2.a.v - Distribution of oil products, the emissions from distribution of oil products are described. Petroleum products are transported by ship, product pipelines, railway tanker cars and tanker trucks, and they are transferred from tank to tank. The main sources of NMVOC emissions from petrol distribution as a whole were fugitive emissions from handling and transfer (filling/unloading) and container losses (tank breathing). Experts consider the emissions from aircraft refuelling to be non-existent, since the equipment used for such refuelling is fitted with dry couplings. The emissions from filling private heating-oil tanks are also very low thanks to high safety standards. In this category, petroleum products that have undergone fractional distillation in refineries are handled and distributed, i.e. processes in which gaseous products are separated out. For this reason, no significant methane emissions are expected. Only in storage of certain petroleum products can small quantities of methane escape.
Table 10: Annual activity data for the distribution of oil products
| Activity | Unit | 1990 | 1995 | 2000 | 2005 | 2010 | 2015 | 2019 | 2020 |
|---|---|---|---|---|---|---|---|---|---|
| number of petrol stations | No | 19,317 | 17,957 | 16,324 | 15,187 | 14,744 | 14,531 | 14,449 | 14,459 |
| distribution of diesel | kt | 21,817 | 26,208 | 28,922 | 28,531 | 32,128 | 36,756 | 37,848 | 35,163 |
| distribution of jet fuel | kt | 4,584 | 5,455 | 6,939 | 8,049 | 8,465 | 8,550 | 10,239 | 4,725 |
| distribution of light heating oil | kt | 31,803 | 34,785 | 27,875 | 25,380 | 21,005 | 16,127 | 15,061 | 15,558 |
| distribution of domestic petrol | kt | 31,257 | 30,333 | 28,833 | 23,431 | 19,634 | 18,226 | 17,966 | 16,218 |
Transport
Inland-waterway gasoline tankers retain considerable quantities of gasoline vapours in their tanks after their gasoline has been unloaded. When the ships change loads or spend time in port, their tanks have to be ventilated. With such ships being ventilated on average 277 times per year, the quantity of NMVOC emitted in these operations amounts to 336 - 650 t 12). The highest value in the range is used to calculate the relevant emissions. About 13 million m³ of gasoline fuel are transported annually in Germany via railway tank cars. Transfer/handling (filling/unloading) and tank losses result in annual emissions of only 1,400 t VOC 13). The emissions situation points to the high technical standards that have been attained in railway tank cars and pertinent handling facilities.
Filling stations
Significant quantities of fugitive VOC emissions are released into the environment during transfers from tanker vehicles to storage facilities and during refuelling of vehicles. To determine emissions, a standardised emission factor of 1.4 kg/t is used. This value refers to the saturation concentration for hydrocarbon vapours and thus, corresponds to the maximum possible emissions level in the absence of reduction measures. The immission-control regulations issued in 1992 and 1993 (20th BImSchV 14); 21st BImSchV, 15)) that required filling stations to limit such emissions promoted a range of reduction measures. The relevant reductions affect both the area of gasoline transfer and storage (20th BImSchV) and the area of fuelling of vehicles with gasoline at filling stations (21st BImSchV). The use of required emissions-control equipment, such as vapour-balancing (20th BImSchV) and vapour-recovery (21st BImSchV) systems, along with the use of automatic monitoring systems (via the amendment of the 21st BImSchV on 6 May 2002), have brought about continual reductions of VOC emissions; the relevant high levels of use of such equipment are shown in the table below (Table 151). In emissions calculation, the two ordinances’ utilisation and efficiency requirements for filling stations in service are taken into account. The following assumptions, based on the technical options currently available, are applied:
| Ordinance | Factor | ||
|---|---|---|---|
| 20th BImSchV | Vapour balancing | Degree of utilisation | 98 % |
| 20th BImSchV | Vapour balancing | Efficiency | 98 % |
| 21st BImSchV | Vapour recovery | Degree of utilisation | 98 % |
| 21st BImSchV | Vapour recovery | Efficiency | 85 % |
In addition, permeation of hydrocarbons occurs in tank hoses. The DIN EN 1360 standard sets a limit of 12 ml / hose meter per day for such permeation. From analysis of measurements, UBA experts have adopted a conservative factor of 10ml/m per day. That factor is used to determine the NMVOC emissions. The calculation is carried out in accordance with the pertinent formula of the University of Stuttgart's Institute for Machine Components 16):
Number of service stations * number of fuel pumps per service station * number of hoses per fuel pump * hose length * emission factor.
Cleaning of transport vehicles
Tank interiors are cleaned prior to tank repairs and safety inspections, in connection with product changes and with lease changes. The inventory currently covers cleaning of railway tank cars. The residual amounts remaining in railway car tanks after these have been emptied – normally, between 0 and 30 litres (up to several hundred litres in exceptional cases) – are not normally able to evaporate completely. They thus produce emissions when the insides of tanks are cleaned. Each year, some 2,500 cleaning operations are carried out on railway tank cars that transport gasoline. The emissions released, via exhaust air, in connection with cleaning tank cars' interiors amount to about 40,000 kg/a VOC (Joas et al., 2004), p. 34. 17). Any additional prevention and reduction measures could affect emissions in this category only slightly. At the same time, emissions can be somewhat further reduced from their current levels via a combination of various technical and organizational measures. Emissions during handling – for example, during transfer to railway tank cars – are produced especially by residual amounts of gasoline that remain after tanks have been emptied. Such left-over quantities in tanks can release emissions via manholes the next time the tanks are filled. A study is thus underway to determine the extent to which “best practice” is being followed at all handling stations, and whether this extent has to be taken into account in emissions determination. In addition, improvements of fill nozzles enhance efficiency in prevention of VOC emissions during refuelling. Pursuant to the UBA text (Joas et al., 2004), 18) a total of 1/3 of all relevant transports are carried out with railway tank cars. The remaining 2/3 of all transports are carried out by other means – primarily with road tankers. The 1/3 to 2/3 relationship given by the report is assumed to be also applicable to the emissions occurring in connection with cleaning. Currently, the inventory includes 36,000 kg of NMVOC emissions from cleaning of railway tank cars. Emissions from cleaning of other transport equipment – primarily road tankers – are derived from that figure; they amount to about 70,000 kg NMVOC. More-thorough emissions collection upon opening of manholes of railway tank cars (a volume of about 14.6 m³ escapes), along with more thorough treatment of exhaust from cleaning tank interiors, could further reduce VOC emissions. Exhaust cleansing is assumed to be carried out via one-stage active-charcoal adsorption. For an initial load of 1 kg/m³, exhaust concentration levels can be reduced by 99.5 %, to less than 5 g/m³. As a result, the remaining emissions amount to only 1.1 t. This is equivalent to a reduction of about 97 % from the determined level of 36.5 t/a (without adsorption) (Joas et al. (2004), p. 34) 19).
Generally, the emission factors listed below have been verified by the study 20).
| Process responsible for NMVOC emissions | Emission factor [kg/t] | |
|---|---|---|
| Drip losses in refuelling at filling stations | gasoline | 0.117 |
| Transfers from road tankers to filling stations (20th Ordinance Implementing the Federal Immission Control Act – vapour displacement) | gasoline | 1.4 |
| Ventilation in connection with transports with inland-waterway tankers | gasoline | 0.025 |
| Transfers from filling station tanks to vehicle tanks (21st Ordinance Implementing the Federal Immission Control Act – vapour recovery) | gasoline | 1.4 |
| Drip losses in refuelling at filling stations | diesel | 0.1 |
| Transports from refineries to transport vehicles | diesel | 0.008 |
| Transfers from filling-station tanks to vehicle tanks | diesel | 0.003 |
| Drip losses in refuelling at transfer stations | light heating oil | 0.0011 |
| Transports from refineries to transport vehicles | light heating oil | 0.0053 |
| Transfers from filling-station tanks to vehicle tanks | light heating oil | 0.0063 |
Recalculations
Please refer to overarching chapter 1.B - Fugitive Emissions from fossil fuels
Planned improvements
No further improvements are planned.