meta data for this page
2.A.1 - Cement Production
Short description
| Category Code | Method | AD | EF | ||||||||||||
|---|---|---|---|---|---|---|---|---|---|---|---|---|---|---|---|
| 2.A.1 | T1 | AS | CS | ||||||||||||
| NOx | NMVOC | SO2 | NH3 | PM2.5 | PM10 | TSP | BC | CO | PB | Cd | Hg | Diox | PAH | HCB | |
| Key Category: | -/- | -/- | -/- | -/- | -/- | -/- | -/- | - | - | -/- | -/- | L/- | -/- | -/- | - |
The remarks below refer to production of cement clinkers and clinker grinding (only relevant as a source for particulate matter). The clinker-burning with intensive use of energy emits climate-relevant gases. CO₂ accounts for the great majority of these emissions, but heavy metals are important too.
Methodology
Activity data
cement clinker
Activity data are determined via summation of figures for individual plants (until 1994, activity data were determined on the basis of data of the official member association BDZ). As of 1995, following optimisation of data collection within the association, activity data were compiled by the German Cement Works Association (VDZ), and by its VDZ research institute (located in Düsseldorf), via surveys of German cement plants. The data are supplemented with data for plants that are not BDZ members (in part, also VDZ estimates).
For internal reasons within the association, the data for the years from 2015 onwards is not available from the VDZ. Instead, the cement clinker specification is based on aggregated plant specific ETS-data of DEHSt. A comparison for the years 2005-2014 showed a good correlation between information of the European Emissions Trading (ETS) and the cement clinker production data of the VDZ. So, the cement clinker information from 2015 onwards is based on aggregated data of ETS. All companies are required to report production data within the framework of CO₂-ETS. The EU monitoring guidelines for emissions trading specify a maximum accuracy of 2.5%. Furthermore CKD was taken into account. According to the VDZ, the share of bypass dust in clinker production was between 1% and 2% between 2009 and 2016. For the inclusion as an activity rate, it can be assumed that the share was 2 % from 2009 onwards, for time before only 1%.
grinded cement
This figure is provided by VDZ, but calculated with statistical Data 1)
Emission factors
The emission factors used for emissions calculation are based on figures from research projects as well as from expert judgements.
In the German cement industry, dust separated from clinker burning exhaust gas is returned to the burning process. As a result, there is no need to take account of significant losses of particles via the exhaust-gas pathway. - On the other hand, particulate matter emissions occur during clinker grinding.
EF for Hg is based on aggregated figures for individual plants of PRTR-reporting. The trend estimation is based on an expert judgement and derived from TSP trend.
Table 1: Overview of applied emission factors
| Pollutant | Name of Category | EF | Unit | Trend |
|---|---|---|---|---|
| NOx | clinker burning | 0.5 | kg/t | falling |
| SO2 | clinker burning | 0.25 | kg/t | falling |
| NMVOC | clinker burning | 0.046 | kg/t | constant |
| NH3 | clinker burning | 0.044 | kg/t | falling |
| Hg | clinker burning | 0.022 | g/t | falling |
| Pb | clinker burning | 0.016 | g/t | falling |
| Cd | clinker burning | 0.004 | g/t | falling |
| PCB | clinker burning | 28.0 | µg/t | constant |
| PCDD | clinker burning | 0.040 | µg/t | constant |
| B(a)P * | clinker burning | 1.0 | mg/t | constant |
| PAH-16 * * | clinker burning | 240.0 | mg/t | constant |
| TSP | clinker grinding | 0.046 | kg/t | falling |
| PM10 | clinker grinding | 0.041 | kg/t | falling |
| PM2.5 | clinker grinding | 0.037 | kg/t | falling |
* The data for PAH 1-4 in NFR-Tables only shows the sum of the available 1-4 PAHs, in this case only of BaP.
* * Outside NFR-Tables a different PAH mixture is known, as a result of research for EPA-PAH (PAH16-Standard).
Emissions of HCB are not applicable according to a research result. The table of EF is related to two different AD sets. For purposes of the most pollutants the AD is burnt clinker. For purposes of emission estimation of PM the AD is grinded clinker (included further materials as domestic burnt clinker). NFR tables could provide only one AD (burnt clinker).
Trends in emissions
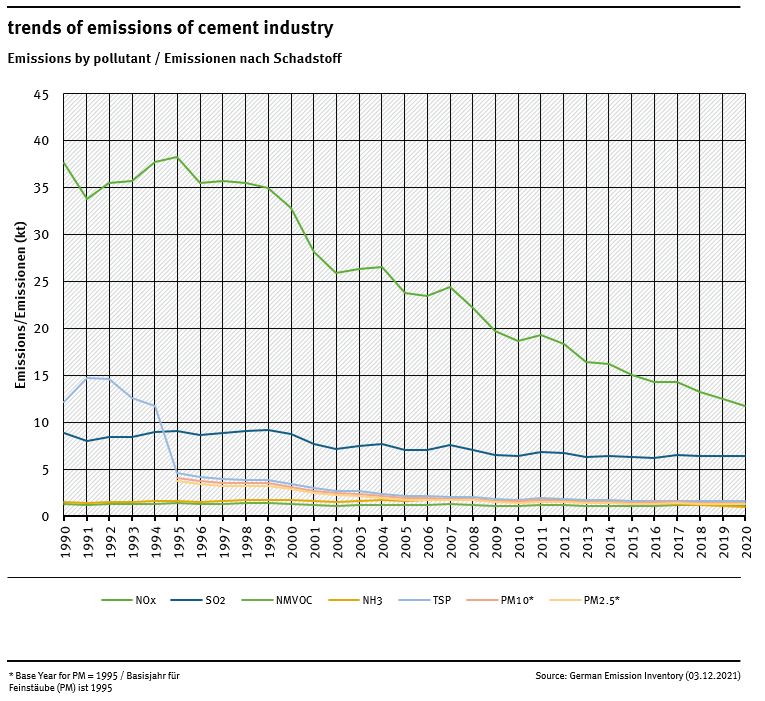
All trends in emissions correspond to trends of emission factors in table above. No rising trends are to identify.
Recalculations
With activity data and emission factors remaining unrevised, no recalculations should be neccessary compared to last year's submission. But since data for PAH 1-4 in NFR-Tables only shows the sum of the available 1-4 PAHs, in this case only of BaP, the Sum of PAH 1-4 have deep decreased. Please see the EF chapter, too.
For pollutant-specific information on recalculated emission estimates for Base Year and 2019, please see the pollutant specific recalculation tables following chapter 8.1 - Recalculations.
Planned improvements
For purposes of updating the EF project was completed in 2021, but results are planned to use in 2022. 2).


