meta data for this page
2.A.3 - Glass Production
Short description
| Category Code | Method | AD | EF | ||||||||||||
|---|---|---|---|---|---|---|---|---|---|---|---|---|---|---|---|
| 2.A.3 | T2 | AS | CS | ||||||||||||
| NOx | NMVOC | SO2 | NH3 | PM2.5 | PM10 | TSP | BC | CO | Pb | Cd | Hg | Diox | PAH | HCB | |
| Key Category: | -/- | -/- | L/- | -/- | -/- | -/- | -/- | - | -/- | -/- | -/- | - | - | - | - |
Germany's glass industry produces a wide range of different glass types that differ in their chemical composition. Germany's glass sector comprises the following sub-sectors: container glass, flat glass, domestic glass, special glass and mineral fibres (glass and stone wool). The largest production quantities are found in the sectors of container glass and flat glass. Further processing and treatment of glass and glass objects are not considered.
Methodology
The emissions are calculated via a higher Tier method resembling a Tier 2 method, as the activity rates are tied to specific emission factors for different glass types.
Activity data
The production figures are taken from the regularly appearing annual reports of the Federal Association of the German Glass Industry (Bundesverband Glasindustrie; BV Glas). “Production” refers to the amount of glass produced, which is considered to be equivalent to the amount of glass melted down.
Emission factors
The procedure used to determine emission factors for the various glass types involved and the pertinent emissions is described in detail in reports of two research projects (2008: Report-No. 0012641), 2021: Texte 45/20212)). The emission factors were calculated for the various industry sectors. The factors vary over time in keeping with industry monitoring, not only as steady trends, but falling in most cases. The most recently EF are for different glass types the following:
Table 1: Overview of most recently applied emission factors
| Pollutant | Unit | Container glass | flat glass | domestic glass | special glass | glass wool | stone wool |
|---|---|---|---|---|---|---|---|
| NOx | kg/ t | 10.766 | 17.708 | 28.602 | 35.558 | 0.5883 | 1.877 |
| SO2 | kg/ t | 0.759 | 15.677 | 0.0599 | 0.1157 | 0.1847 | 2.229 |
| NMVOC | kg/ t | NA | NA | NA | NA | 0.6 | 0.657 |
| CO | kg/ t | 0.0732 | 0.0241 | 0.0661 | 0.1195 | 0.06 | 0.185 |
| NH3 | kg/ t | 0.0026 | 0.0191 | NA | 0.0295 | 1.10 | 1.163 |
| TSP | kg/ t | 0.00863 | 0.01681 | 0.015 | 0.00765 | 0.01096 | 0.643 |
| PM10 | kg/ t | 0.00742 | 0.01429 | 0.0129 | 0.0065 | 0.00932 | 0.0234 |
| PM2.5 | kg/ t | 0.00483 | 0.00773 | 0.0069 | 0.00352 | 0.00504 | 0.0128 |
| As | g/ t | 0.0279 | 0.0104 | 0.0023 | 0.1143 | 0.0354 | NE |
| Pb | g/ t | 0.1237 | 0.0104 | 0.0076 | 0.1158 | 0.1571 | NE |
| Cd | g/ t | 0.0032 | 0.0005 | 0 | 0.0028 | 0.0041 | NE |
| Cr | g/ t | 0.0186 | 0.0029 | 0.0007 | 0.0148 | 0.0236 | NE |
| Cu | g/ t | 0.0035 | 0.02 | 0.0002 | 0.0085 | 0.0056 | NE |
| Ni | g/ t | 0.0048 | 0.0061 | 0.0003 | 0.0142 | 0.0061 | NE |
| Se | g/ t | 0.2794 | 0.0427 | 0.1273 | 0.0454 | 0.01 | NE |
For each glass type the estimated EF are explained in ‘Texte 45/2021’ with an expert votum and uncertainty estimation.
Trends in emissions
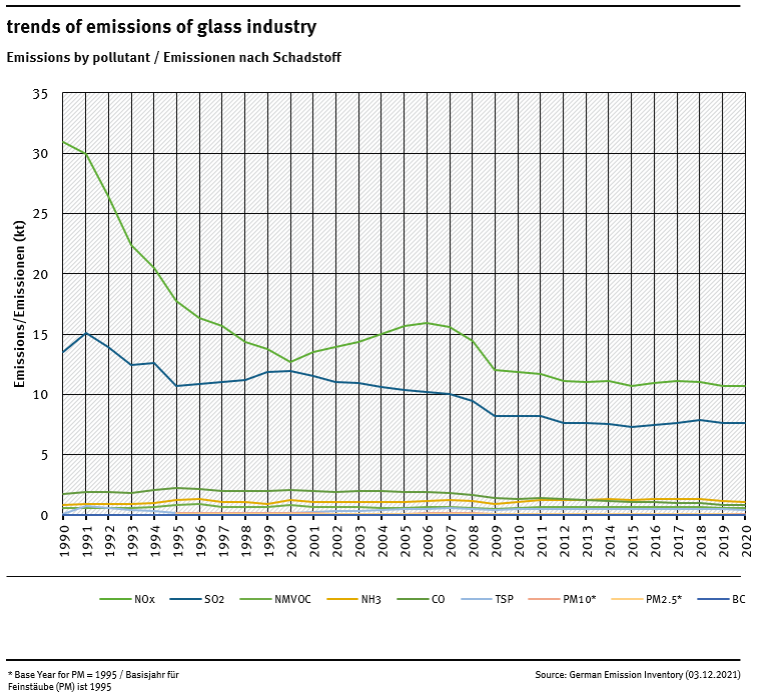
Trends in emissions correspond to trends of emission factors and of production development. The resulting trends are not constant, as a result of different EF for various glass types. So emissions of NOx and SO2 couldn't decrease last years due to increased production Level of relevant products.
Recalculations
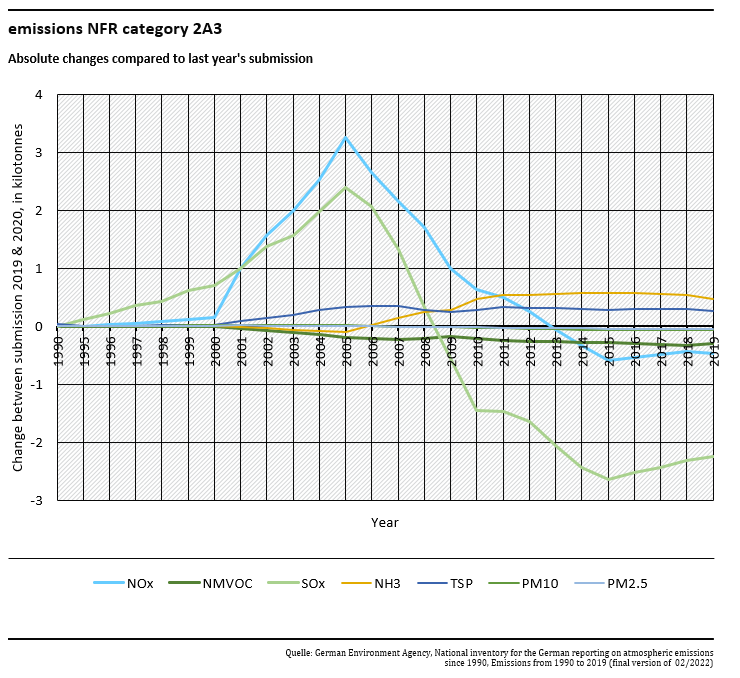
Recalculations were necessary due to updated emission factors for all years. The significant changes can be shown as an absolute difference over time as follows:
More details are shown with 5-year-steps here:
| Pollutant | unit | 1990 | 1995 | 2000 | 2005 | 2010 | 2015 | 2019 |
|---|---|---|---|---|---|---|---|---|
| NOx | kt | 0.00 | 0.00 | 0.15 | 3.25 | 0.63 | -0.58 | -0.47 |
| NMVOC | kt | 0.00 | 0.00 | 0.00 | -0.18 | -0.21 | -0.28 | -0.30 |
| SO2 | kt | 0.00 | 0.11 | 0.70 | 2.40 | -1.45 | -2.63 | -2.24 |
| NH3 | kt | 0.00 | 0.00 | 0.00 | -0.09 | 0.48 | 0.57 | 0.47 |
| TSP | kt | 0.04 | 0.00 | 0.03 | 0.34 | 0.29 | 0.29 | 0.27 |
| PM10 | kt | 0.00 | 0.00 | 0.03 | 0.02 | -0.03 | -0.06 | -0.07 |
| PM2.5 | kt | 0.00 | 0.00 | 0.01 | 0.01 | -0.02 | -0.04 | -0.04 |
| As | t | 0.21 | 0.19 | 0.19 | 0.06 | 0.05 | -0.07 | -0.13 |
| Cd | t | 0.00 | 0.00 | 0.01 | 0.01 | -0.14 | -0.15 | -0.16 |
| Cu | t | 0.09 | 0.10 | -0.22 | -0.54 | -0.29 | -0.30 | -0.35 |
| Cr | t | 0.02 | 0.02 | 0.03 | 0.00 | 0.01 | -0.05 | -0.07 |
| Ni | t | 0.03 | 0.03 | 0.03 | 0.01 | 0.01 | -0.01 | -0.02 |
| Pb | t | 0.07 | 0.08 | 0.10 | 0.07 | -0.52 | -0.89 | -1.04 |
| Se | t | 0.13 | 0.15 | 0.16 | -0.83 | -2.97 | -3.98 | -4.39 |
For pollutant-specific information on recalculated emission estimates for Base Year and 2019, please see the pollutant specific recalculation tables following chapter 8.1 - Recalculations.
Planned improvements
No further improvements are planned.


