meta data for this page
Chapter 5 - NFR 3 - Agriculture (OVERVIEW)
Emissions occurring in the agricultural sector in Germany derive from manure management (NFR 3.B), agricultural soils (NFR 3.D) and agriculture other (NFR 3.I). Germany does not report emissions in category field burning (NFR 3.F) (key note: NO), because burning of agricultural residues is prohibited by law (see Vos et al., 2022)1).
| NFR-Code | Name of Category |
|---|---|
| 3.B | 3.B Manure Management |
| 3.D | 3.D Agricultural Soils |
| 3.F | 3.F Field Burning Of Agricultural Residues |
| 3.I | 3.I Agricultural: Other |
Short description
Emissions occurring in the agricultural sector in Germany derive from manure management (NFR 3.B), agricultural soils (NFR 3.D) and agriculture other (NFR 3.I). Germany does not report emissions in category field burning (NFR 3.F) (key note: NO), because burning of agricultural residues is prohibited by law (see Vos et al., 2022).
The pollutants reported are:
- ammonia (NH3),
- nitric oxides (NOx),
- volatile organic compounds (NMVOC),
- particulate matter (PM2.5, PM10 and TSP) and
- hexachlorobenzene (HCB).
No heavy metal emissions are reported.
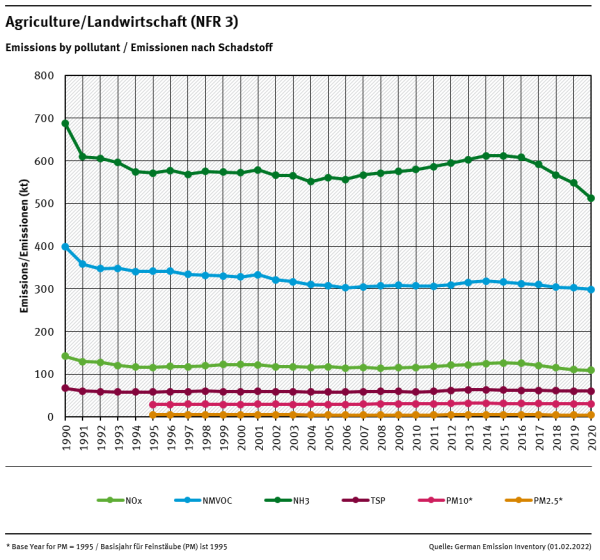
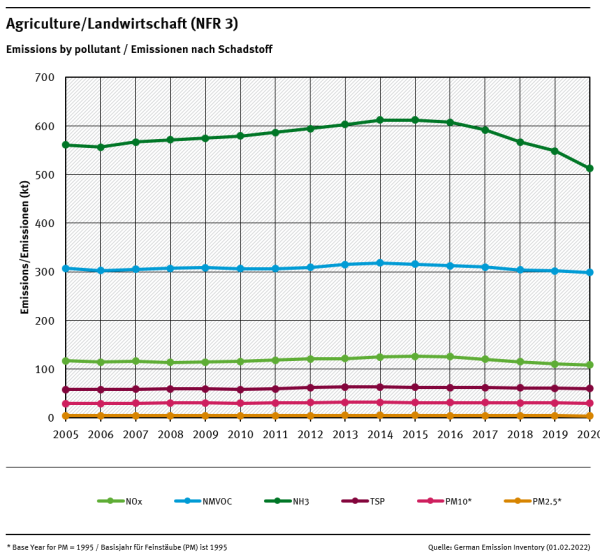
In 2020 the agricultural sector emitted 512.3 Gg of NH3, 108.7 Gg of NOx, 298.9 Gg of NMVOC, 60.3 Gg of TSP, 30.2 Gg of PM10 and 4,4 Gg of PM2.5 and 1.05 kg HCB. The trend from 1990 onwards is shown in the graph below. The sharp decrease of emissions from 1990 to 1991 is due to a reduction of livestock population in the New Länder (former GDR) following the German reunification. The increase of NH3 emissions since 2005 is mostly due to the expansion of anaerobic digestion of energy crops, especially the application of the digestion residues. This is a new emission source which also effects NOx emissions. The decrease of NH3 emissions since 2015 is mostly due to a decline in the amounts of mineral fertilizer sold and stricter regulations concerning application of urea fertilizers. Further details concerning trends can be found in Vos et al., 2022, Chapter 2.
As depicted in the diagram below, in 2020 95.4 % of Germany’s total NH3 emissions derived from the agricultural sector, while nitric oxides reported as NOx contributed 11.1 % and NMVOC 28.9 % to the total NOx and NMVOC emissions of Germany. Regarding the emissions of PM2.5, PM10 and TSP the agricultural sector contributed 5.4 % (PM2.5), 16.7 and 17.8 %, respectively, to the national particle emissions. HCB emissions of pesticide use contributed 22.1 % to the total German emissions.
Mitigation measures
The agricultural inventory model can represent several abatement measures for emissions of NH3 and particles. The measures comprise:
- changes in animal numbers and amount of applied fertilizers
- air scrubbing techniques: yearly updated data on frequencies of air scrubbing facilities and the removal efficiency are provided by KTBL (Kuratorium für Technik und Bauwesen in der Landwirtschaft / Association for Technology and Structures in Agriculture). The average removal efficiency of NH3 is 80 % for swine and 70 % for poultry, while for TSP and PM10 the rates are set to 90 % and for PM2.5 to 70 % for both animal categories. For swine two types of air scrubbers are distinguished: certified systems that remove both NH3 and particles, and non-certified systems that remove only particles reliably.
- reduced raw protein content in feeding of fattening pigs: the german animal nutrition association (DVT, Deutscher Verband Tiernahrung e.V.) provides data on the raw protein content of fattening pig feed, therefore enabling the inventory to depict the changes in N-excretions over the time series. The time series is calibrated using data from official and representative surveys conducted by the Federal Statistical Office.
- reduced raw protein content in feeding and feed conversion rates of broilers: the German animal nutrition association (DVT, Deutscher Verband Tiernahrung e.V.) provides data on the raw protein content of fattening broiler feed, and feed conversion rates of broilers. This makes it possible to model the changes in N-excretions over the time series.
- low emission spreading techniques of manure: official agricultural censuses survey the distribution of different manure spreading techniques and how fast organic fertilizers are incorporated into the soil. Germany uses distinct emission factors for different methods, techniques and incorporation durations.
- covering of slurry storage: agricultural censuses survey the distribution of different slurry covers. Germany uses distinct emission factors for the different covers.
- use of urease inhibitors: for urea fertilizer the German fertilizer ordinance prescribes the use of urease inhibitors or the direct incorporation into the soil from 2020 onwards.
The NH3 emission factor for urea fertilizers is therefore reduced by 70% from 2020 onwards, according to Bittman et al. (2014, Table 15)2).
For NOx and NMVOC no mitigation measures are included.
Reasons for recalculations
(see Chapter 8.1 - Recalculations)
The following list summarizes the most important reasons for recalculations. Recalculations result from improvements in input data and methodologies (for details see Vos et al. (2022), Chapter 3.5.2).
1) Incorporation of data from the 2020 official agricultural census. This changes data on housing systems, manure storage systems, manure application systems and cattle grazing. This results in some significant changes in the calculated emissions as far back as the year 2000 compared to the previous year's submission.
2) Dairy cows: Update of milk yield and slaughter weight for the year 2019.
3) Heifers: Minor changes in the nutrient content of some feed ingredients.
4) Suckler cows: modeling of the energy requirement and feed intake has been updated and adapted based on the dairy cow model.
5) Male cattle > 2 years: Update of weights from 1999 onwards.
6) Sows: Update of the number of piglets per sow in 2019.
7) Fattening pigs: New data on raw protein content, ash content and digestibility of feed from 1990 onwards.
8) Broilers: New data on raw protein content, ash content and digestibility of feed from 2000 onwards. Update of the national gross production of broiler meat in 2019.
9) Turkeys: Update of input data (slaughter weight, weight gain and feed conversion coefficient) for the years 2017-2019.
10) Geese: update (increase) of the amount of bedding material (straw) and update (increase) of N-excretions for the whole time series.
11) Laying hens: Improved interpolation of start weights and final weights for the whole time series.
12) Pullets: Improved interpolation of start weights and final weights for the whole time series.
13) Anaerobic digestion of animal manures: Update of activity data in all years.
14) Mineral fertilizers: : New weighting procedure for the latest year: 2020 weighted mean from 2019 (weight 1/3) and 2020 (weight 2/3)).
15) Application of sewage sludge to soils: Update of activity data in 2018 and 2019. Minor corrections of activity data in one federal state for the whole time series.
16) Anaerobic digestion of energy crops: Update of activity data in 2019.
17) Soils: Minor corrections of cultivated areas and yields in several years.
18) Pesticides: Recalculations were made for the complete time series due to the changes and new information given by the BVL for the amount of domestic sales of the active substances Lindane (1990 – 1997), Chlorothalonil and Picloram (2019) and the maximum amount of HCB in the active substance Chlorothalonil of the FAO specification was used for the calculation in the period 2005 - 2017.
Visual overview
Chart showing emission trends for main pollutants in NFR 3 - Agriculture:
Contribution of NFR categories to the emissions/Anteile der NFR-Kategorien an den Emissionen
Specific QA/QC procedures for the agriculture sector
Numerous input data were checked for errors resulting from erroneous transfer between data sources and the tabular database used for emission calculations. The German IEFs and other data used for the emission calculations were compared with EMEP default values and data of other countries (see Vos et al., 2022). Changes of data and methodologies are documented in detail (see Vos et al. 2022, Chapter 3.5.2).
A comprehensive review of the emission calculations was carried out by comparisons with the results of Submission 2021 and by plausibility checks.
Once emission calculations with the German inventory model Py-GAS-EM are completed for a specific submission, activity data (AD) and implied emission factors (IEFs) are transferred to the CSE database (Central System of Emissions) to be used to calculate the respective emissions within the CSE. These CSE emission results are then cross-checked with the emission results obtained by Py-GAS-EM.
Model data have been verified in the context of a project by external experts (Zsolt Lengyel, Verico SCE). Results show that input data are consistent with other data sources (Eurostat, Statistisches Bundesamt / Federal Statistical Office) and that the performed calculations are consistently and correctly applied in line with the methodological requirements.
Furthermore, in addition to UNFCCC, UNECE and NEC reviews, the Py-GAS-EM model is continuously validated by experts of KTBL (Kuratorium für Technik und Bauwesen in der Landwirtschaft, Association for Technology and Structures in Agriculture) and the EAGER group (European Agricultural Gaseous Emissions Inventory Researchers Network).