meta data for this page
Chapter 9 - Projections
In May 2019, Germany published its first National Air Pollution Control Programme (NAPCP) under the revised NEC directive (EU) 2016/2284. It covers all up-to-date information on projected air pollutant emissions and mitigation approaches in detail. In addition, Germany also published the same results under the CLRTAP using the Annex IV projected emissions templates, presenting both the “with measures” (WM) and the “with additional measures” (WAM) scenarios as defined in the NAPCP 2019 mentioned to above. According to Article 8 (6) of the EU Directive 2016/2284, these projections must be updated and reported every two years. Emission projections under the CLRTAP are therefore fully aligned with the reporting presented in the context of the NEC directive.
Based on the emissions inventory submission 2020 these results can be summarized as follows:
| kt | NOX | SO2 | NMVOC | NH3 | PM2.5 |
|---|---|---|---|---|---|
| National Total 2005 (submission 2020) | 1522 | 477 | 1183 | 641 | 141 |
| National Total 2010 (submission 2020) | 1358 | 405 | 1057 | 641 | 123 |
| National Total 2018 (submission 2020) | 1084 | 289 | 816 | 636 | 97 |
| Reduction Commitment 2020 [%] | -39 | -21 | -13 | -5 | -26 |
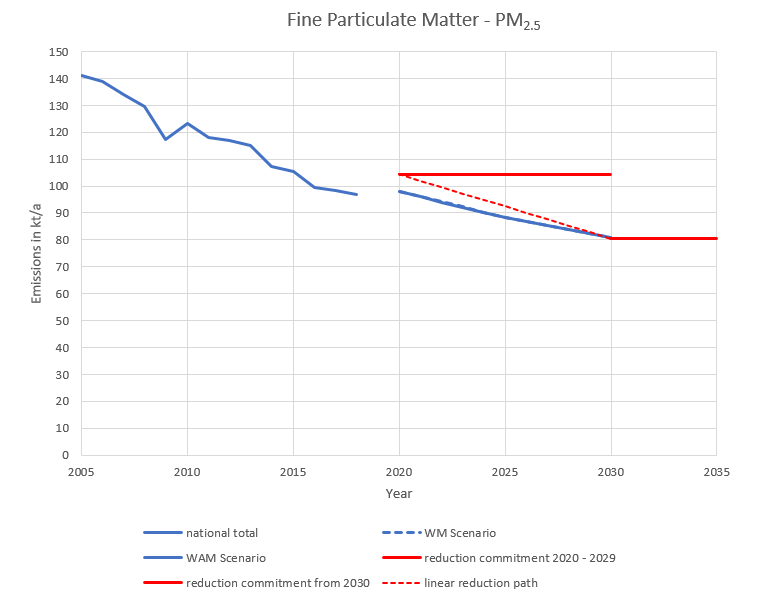
| Reduction Commitment 2020 [kt] | 929 | 377 | 1029 | 609 | 104 |
| Projected Emissions 2020 WM [%] | 36 | 39 | 34 | 11 | 30 |
| Projected Emissions 2020 WAM [%] | 36 | 39 | 34 | 11 | 30 |
| Reduction Commitment 2030 [%] | -65 | -58 | -28 | -29 | -43 |
| Reduction Commitment 2030 [kt] | 533 | 200 | 852 | 455 | 80 |
| Projected Emissions 2030 WM [%] | 62 | 60 | 32 | 20 | 43 |
| Projected Emissions 2030 WAM [%] | 62 | 62 | 32 | 29 | 43 |
| Notes: This table does neither include NOX and NMVOC emissions from agriculture (NFR 3B and 3D) nor future adjustments. Projected emissions and historic data are based on submission 2020. All values have been rounded to whole numbers. The calculation for determining the reduction commitment took place with the exact values in 2005. The rounding can lead to slight deviations. | |||||
Results
Modelling different scenarios in our database, we finally calculated the following numbers for Germany's emissions in 2030:
| NOX | SO2 | NMVOC | NH3 | PM2.5 | |
|---|---|---|---|---|---|
| Reduction commitment [% reduction vs. 2005] | -65 | -58 | -28 | -29 | -43 |
| With measures [kt] | 583.3 | 191.7 | 805.3 | 512.1 | 81.0 |
| With measures [% reduction vs. 2005] | -62 | -60 | -32 | -20 | -43 |
| With additional measures [kt] | 576.9 | 180.3 | 804.1 | 454.2 | 80.8 |
| With additional measures [% reduction vs. 2005] | -62 | -62 | -32 | -29 | -43 |
| Amendment of 13th BImSchV | -4.86 | ||||
| Agriculture package | -9.4 | -3.38 | -57.98 | -0.24 | |
| Promotion of public transport, cycling and walking | -1.46 | -1.17 | -0.10 | -0.01 | |
| Low-sulphur fuels in industry | -11.37 | ||||
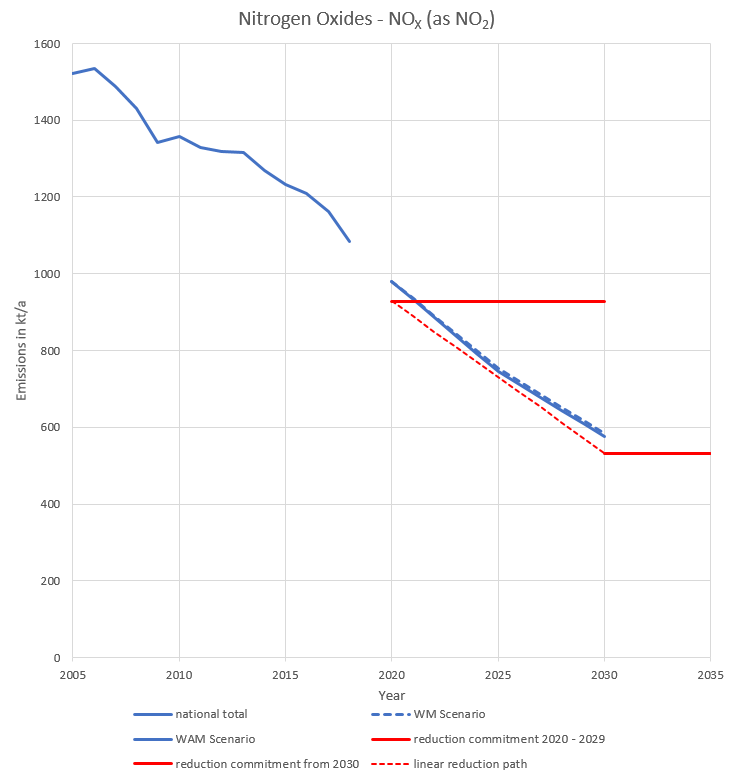
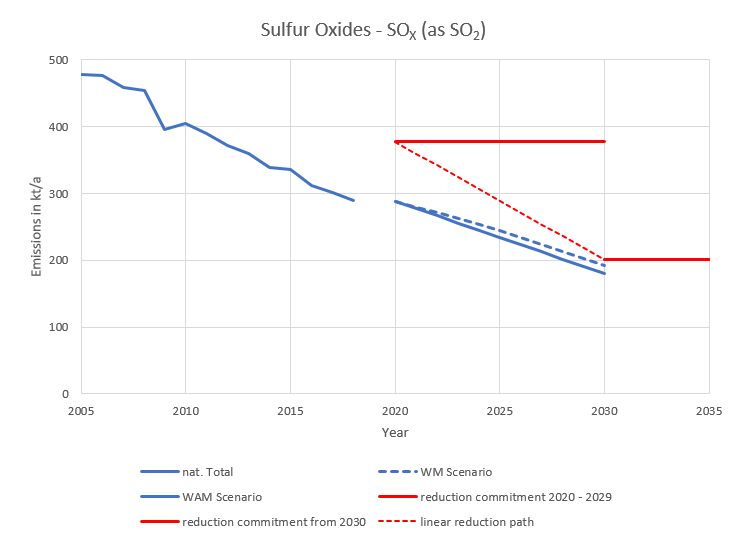
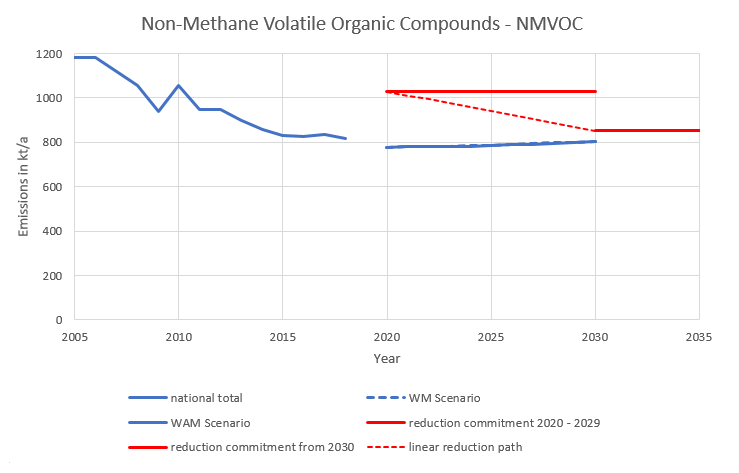
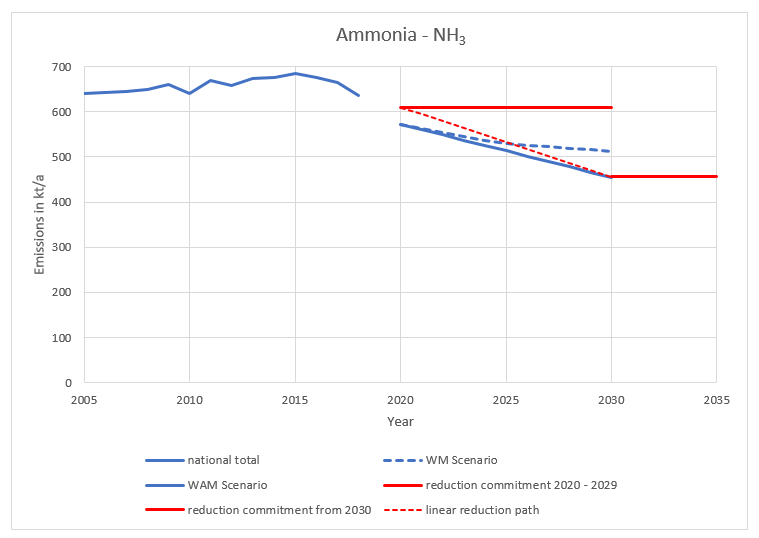
With these numbers, Germany will meet its reduction commitments for almost all pollutants in 2030 at least in the WAM scenario. Only NOX does not achieve the reduction commitments.
The following figures show the developments for each pollutant in the WM and WAM scenarios. In addition, the reduction commitments for 2020 to 2029 and from 2030 as well as the linear reduction path are shown. Please note that projected emissions were only calculated for the years 2020, 2025 and 2030. A linear reduction in the years between can not be assumed but is shown in the graphs just for illustrative reasons.


