meta data for this page
Explanation of Key Trends - Nitrogen Oxide
Obligations
Within the scope of the LRTAP convention, the Federal Republic of Germany was obliged to reduce emissions of NOₓ to the 1987 level of 3,177kt by 1994. However, this value is inconsistent with the time series data after 1990 because, for example, it does not include any emissions from the agricultural sector. But emissions were successfully reduced by close to 30% to 2,255 kt in this period, exceeding the obligatory requirements of the protocol and also meeting the additional voluntary commitment that was entered into by Germany and 11 other ECE countries (reduction of NOx emissions before 1998 by 30% compared to 1986 levels).
More recently, Germany has made a commitment under the multicomponent protocol to further minimise NOₓ emissions. By 2010, it will no longer be permissible to exceed a National Emission Ceiling of 1,081kt NOₓ for Germany as whole. The revised Gothenburg Protocol and the revised NEC Directive both define emission reduction targets relative to a 2005 base year, mandating 39% (2020) and 65% (2030) reductions respectively.
While Germany's compliance with these obligations is not discussed here, further information on this subject can be found in Chapter 9 - Projections and Chapter 11 - Adjustments and Emission Ceiling Exceedance.
Main drivers
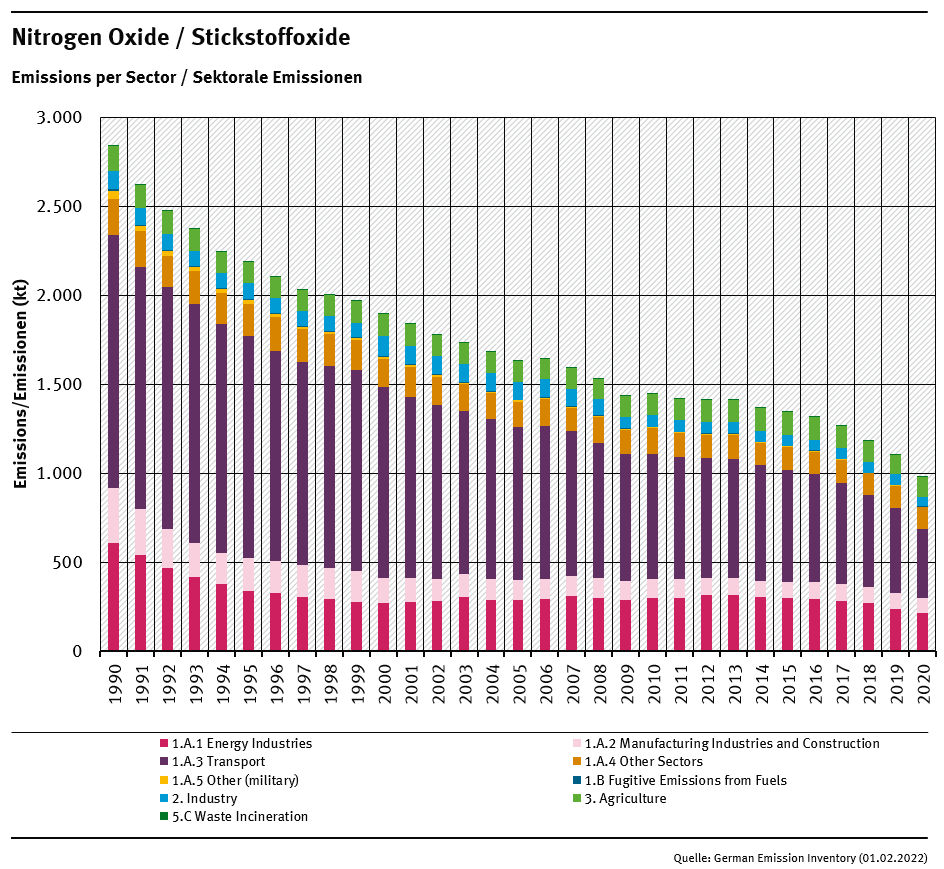
NOₓ total emissions show a falling trend from 1990 onwards, with emission reductions of 65.6% between 1990 and 2020 and steadily falling emissions in the last years. The Main Driver for NOₓ emissions is Fuel Combustion (NFR 1.A) with over 91% of 1990 emissions and a 69% reduction from 1990 to 2020. More than half of the 1990 emissions from Fuel Combustion (NFR 1.A) and a similar reduction (-73%) between 1990 and 2020 comes from Road Transportation (NFR 1.A.3.b), mainly due to constantly improving fuels and increasingly stricter regulations resulting in technical improvements. The rest of the 1990 emissions mainly comes from Energy Industries (NFR 1.A.1) with a 24% share of 1990 Fuel Combustion (NFR 1.A) emissions and a 65% reduction and to a lesser extend from Manufacturing Industries and Construction (NFR 1.A.2) with an 12% share and 73% reduction followed by Other Sectors (NFR 1.A.4) with a share of 8% in 1.A and a 41% reduction between 1990 and 2020. For Manufacturing Industries and Construction (NFR 1.A.2) some emissions were reassigned to the Industrial Processes (NRF 2) starting from the year 2000, leading to lower emissions from the energy sector and a similar rise in the Industrial processes.
NOₓ Emissions 1990-2020
| Total Emissions (kt) | Trend: latest compared to | |||||||||||||||
|---|---|---|---|---|---|---|---|---|---|---|---|---|---|---|---|---|
| 1990 | 1995 | 2000 | 2005 | 2010 | 2011 | 2012 | 2013 | 2014 | 2015 | 2016 | 2017 | 2018 | 2019 | 2020 | 1990 | last years |
| 2.839 | 2.186 | 1.893 | 1.632 | 1.445 | 1.419 | 1.411 | 1.410 | 1.365 | 1.342 | 1.315 | 1.264 | 1.179 | 1.106 | 978 |  -65.6% -65.6% | |