meta data for this page
Explanation of Key Trends - Non Methane Volatile Organic Compounds
Obligations
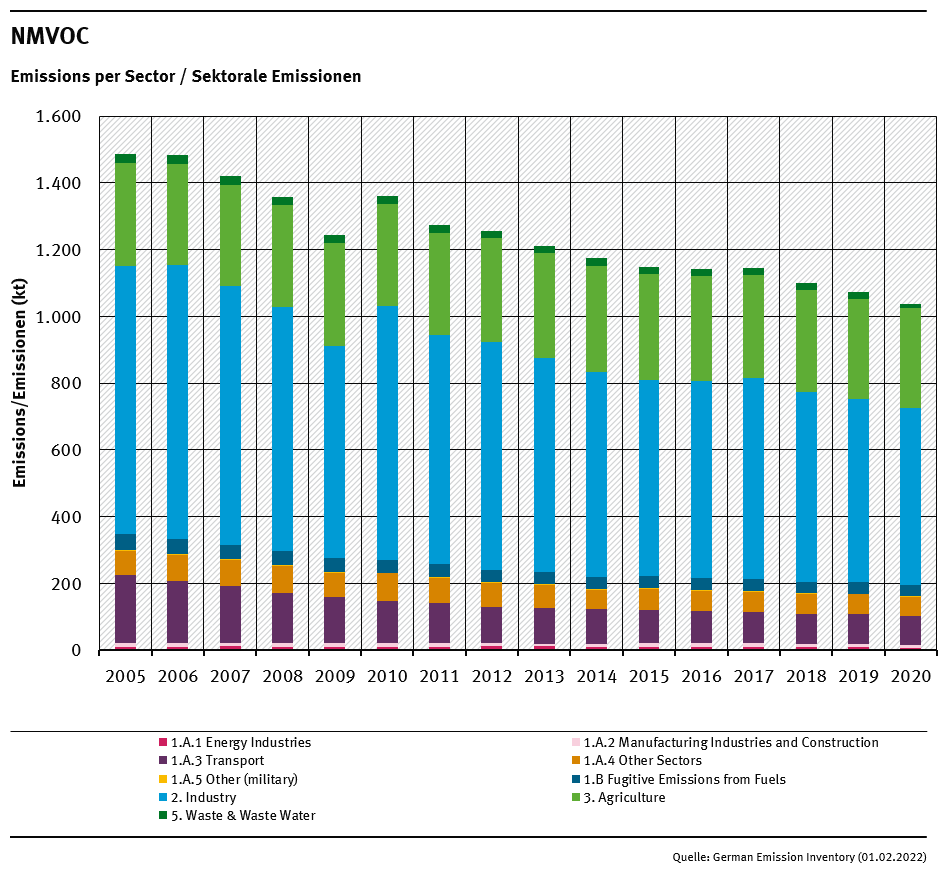
Germany has made a commitment under the Gothenburg Protocol to reduce NMVOC emissions. Since 2010, it is no longer permissible to exceed a National Emission Ceiling of 995kt NMVOC for Germany as whole. The revised Gothenburg Protocol and the revised NEC Directive both define emission reduction targets relative to a 2005 base year, mandating 13% (2020) and 28% (2030) reductions respectively.
While Germany's compliance with these obligations is not discussed here, further information on this subject can be found in Chapter 9 - Projections and Chapter 11 - Adjustments and Emission Ceiling Exceedance.
Main drivers
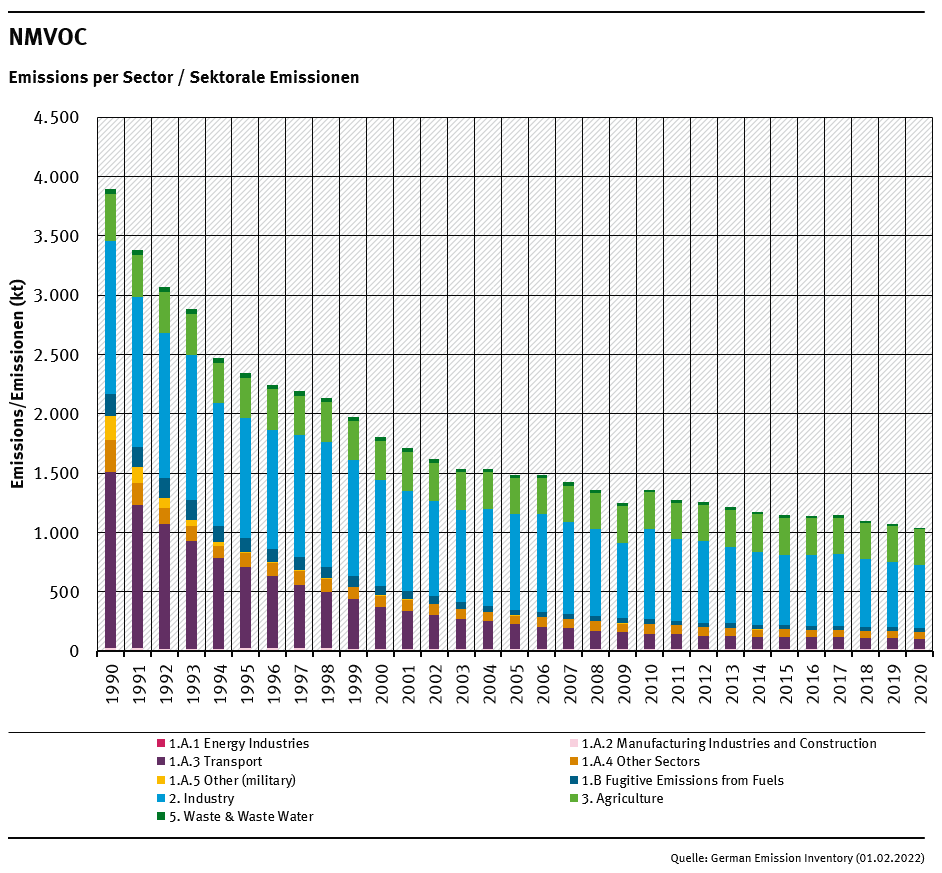
NMVOC total emissions show a falling trend from 1990 onwards, with emission reductions of 73.4% between 1990 and 2020 with a bump in 2010 after the dent of 2008 and 2009 due to the economic situation. After a period of stagnating emissions, The last few years show a slight yearly emission reduction of 3% on average. The Main Drivers for NMVOC emissions are Fuel Combustion (NFR 1.A) with about half of total 1990 emissions and a 92% reduction between 1990 and 2020. In the Fuel Combustion category, Road Transport (NFR 1.A.3.b) is responsible for about three quarters of the 1990 Fuel Combustion emissions, with Passenger Cars (NFR 1.A.3.b.i) emitting nearly all of it. Reductions of about 94% in those categories between 1990 and 2020 are mainly due to increasingly stricter regulations, especially incentives for automobile users to retrofit/buy cars with catalytic converters. Furthermore the implementation of the Technical Instruction on Air Quality Control (TA-Luft 2002), to decreases in emissions from petrol storage and from fuelling of motor vehicles (1.B.2.a.v) - as a result of implementation of the 20th and 21st Ordinances on the Execution of the Federal Immission Control Act (BImSchV) - and to reduced petrol consumption play a major role in the reduction of NMVOC emissions within the category Fugitive Emissions from fossil fuels (NRF 1.B.2). Substantial emissions also come from Non-Energy Products from Fuels (NFR 2.D), emitting 31% of total 1990 emissions and a 59% reduction between 1990 and 2020.
NMVOC Emissions 1990-2020
| Total Emissions (kt) | Trend: latest compared to | |||||||||||||||
|---|---|---|---|---|---|---|---|---|---|---|---|---|---|---|---|---|
| 1990 | 1995 | 2000 | 2005 | 2010 | 2011 | 2012 | 2013 | 2014 | 2015 | 2016 | 2017 | 2018 | 2019 | 2020 | 1990 | last years |
| 3.892 | 2.342 | 1.806 | 1.487 | 1.362 | 1.272 | 1.257 | 1.212 | 1.174 | 1.147 | 1.141 | 1.145 | 1.099 | 1.072 | 1.036 |  -73.4% -73.4% | |