meta data for this page
2.D.3.i - Other Solvent Use
Short description
In source category 2.D.3.i - Other Solvent Use, emissions from various product groups and processes and also from lubricants use in stationary and mobile applications are reported. Relevant pollutants are NMVOC and some heavy metals.
| Category Code | Pollutants | Method | AD | EF | |||||||||||
|---|---|---|---|---|---|---|---|---|---|---|---|---|---|---|---|
| 2.D.3.i - Other solvent use | NMVOC | T2 | NS | CS | |||||||||||
| 2.D.3.i - Use of lubricants in stationary applications | NMVOC | T2 | NS | CS | |||||||||||
| 2.D.3.i - Use of lubricants in mobile applications | Cd, Cr, Cu, Ni, Pb, Se and Zn | T1 | NS, M | D | |||||||||||
| NOx | NMVOC | SO2 | NH3 | PM2.5 | PM10 | TSP | BC | CO | PB | Cd | Hg | Diox | PAH | HCB | |
| Key Category: | - | L/T | - | - | - | - | - | - | - | - | - | - | - | - | - |
2.D.3.i - Other solvent use
Method
In sub-category 2.D.3.i - Other product use: Other solvent use the following product groups and processes are taken into consideration:
- Glass and mineral wool enduction
- Fat, edible and non-edible oil extraction
- Application of glues and adhesives (paper and packaging; wood; footwear; transport; Do-it-yourself-applications; others)
- Preservation of wood
- Underseal treatment and conservation of vehicles
- Vehicles dewaxing
- Other:
- Plant protectives
- Dichloromethane in strippers
- Removal of paints from incorrectly coated aluminium parts
- Removal of paint from steel parts
- Concrete additives
- De-icing (Aircraft de-icing; De-icing of operated areas; Other de-icing applications)
- Applications in scientific laboratories (R&D; analyses; universities)
General procedure
NMVOC emissions are calculated in accordance with a product-consumption-oriented approach. In this approach, solvent-based products or solvents are allocated to the source category, and then the relevant NMVOC emissions are calculated from those solvent quantities via specific emission factors. Thus, the use of this method is possible with the following valid input figures for each product group:
- Quantities of VOC-containing (pre-) products and agents used in the report year,
- The VOC concentrations in these products (substances and preparations),
- The relevant application and emission conditions (or the resulting specific emission factor).
The quantity of the solvent-based (pre-)product corresponds to the domestic consumption which is the sum of domestic production plus import minus export.
| VOC Emission = domestic consumption of a certain product * solvent content * specific emission factor |
|---|
The calculated NMVOC emissions of different product groups for a source category are then aggregated. The product / substance quantities used are determined at the product-group level with the help of production and foreign-trade statistics. Where possible, the so-determined domestic-consumption quantities are then further verified via cross-checking with industry statistics.
Discussion of emission trends
General information
Since 1990, so the data, NMVOC emissions from use of solvents and solvent-containing products in general have decreased by nearly 55%. The main emissions reductions have been achieved in the years since 1999. This successful reduction has occurred especially because of regulatory provisions such as the 31st Ordinance on the execution of the Federal Immissions Control Act (Ordinance on the limitation of emissions of volatile organic compounds due to the use of organic solvents in certain facilities – 31. BImSchV), the 2nd such ordinance (Ordinance on the limitation of emissions of highly volatile halogenated organic compounds – 2. BImSchV) and the TA Luft.
Specific information
Until 1999, data of the present source categories 2.D.3.a, 2.D.3.h and 2.D.3.i were treated as one source group. Since 2000, a more detailed data collection enables to follow the development of source group 2.D.3.i, which accounts for about 1/5 to 1/4 of total NMVOC emissions from solvent-based products. Compared to 2005, emissions went down mainly due to a clearly reduced consumption of concrete additives.
A decrease in the NMVOC emissions of Category 2.D.3.i can be observed since 2005. The following product groups cause major emissions in category 2.D.3.i:
- Concrete additives,
- Underseal treatment and conservation of vehicles,
- Application of glues and additives,
- Deicing and
- Fat, edible and non-edible oil extraction
These six activities comprise together 88 – 93% of total emissions of 2.D.3.i depending on the considered years.
Uncertainties
Uncertainties for emissions for each technology / application were obtained by error propagation and refer to the 95% confidence interval.
Domestic Consumption: The applied relative uncertainty was ±10% for all applications.
Solvent content: For each application / product, a relative error at ±15% was applied (exception: lubricants at 25%), but not exceeding 100% or falling below 0%.
Emission factors: A relative error at ±15% was applied, but not exceeding 100% or falling below 0%. Exceptions were de-icing applications, applications in scientific laboratories and lubricants with a relative error at 25%.
Hence, the overall uncertainty of emissions caused by application of products of this source group is between 40% and 60%.
Recalculations
As the emission data for the 2021 reporting could not be completely revised due to staff constraints and for these reasons the emission data for 2018 had to be updated in last year's reporting, a complete recalculation of the emission data for 2019 and 2020 was carried out for this year's reporting. In doing so, it was also possible to take into account the current changes in the systematics of the national production statistics and the foreign trade statistics.
For pollutant-specific information on recalculated emission estimates for Base Year and actual year, please see the pollutant specific recalculation tables following chapter 8.1 - Recalculations.
Planned improvements
No category-specific improvements are planned.
Use of lubricants in stationary applications
Method
Sub-category 2.D.3.i - Other product use: Use of lubricants in stationary applications comprises the entire use phase including the process stages of input and output. The products or lubricants covered here, are:
- Compressor oils
- Turbine oils
- Gear oils (automotive oils including automatic transmission fluids, industrial-gear oils)
- Hydraulic oils
- Insulating oils
- Machine oils
- Process oils
- Other industrial oils not for lubricating purposes
- Metal working fluids fluids (hardening oils, water-miscible and not water-miscible metal working fluids, anticorrosive oils)
- Greases
- Base oils
- Extracts from lubricant refining
2-stroke engine oils are excluded here as they are considered to be part of the 2-stroke fuel and are therefore burned intentionally in 2-stroke engines as applied in road vehicles (mopeds) and other mobile machinery (chainsaws, lawn mowers etc.). In contrast, emissions from the unintended co-incineration of lubricants in mobile machinery and vehicles are reported in Use of lubricants in mobile applications.
‘NMVOC’ is defined in keeping with the VOC definition found in the EC solvents directive. For purposes of the definition of solvents, the term ‘solvent use’ is also defined in keeping with the EC solvents directive.
Activity data
The emissions calculation method follows a Tier-2 approach. It uses national statistical data [Lit. 1] for the quantities placed on the market specific per lubricant types as activity rate and specific emission factors for each lubricant type. It is assumed that the amount of lubricants placed on the market per year equals the lubricant use (consumption) in the same year.
The consumption of lubricants in Germany has remained at a relatively constant level since 1990, apart from a sharp decrease in 2009 and in 2020.
Emission factors
Along the life cycle of the different lubricant types, different kinds of losses occur. Only some types of losses are of relevance with regard to air emissions and the different lubricants types differ significantly from each other. Relevant emitted pollutants identified for lubricants are NMVOC and CO2. But only for engine oils used in machinery and in vehicles emission of both could be accounted for due to combustion of a small fraction of lubricating oils directly resulting in CO2 emissions.
For Insulating oils [Lit. 3, 5], Process oils [Lit. 4, 10, 11], Greases [Lit. 10, 11] and Extracts from lubricant production [Lit. 2, 10, 11] no emissions expected.
All emission factors are are constant in the entire time series. They were determined in a research project (UBA, 2018) [Lit. 14].
Table 1: Tier 2 emission factors for specific lubricant-type groups in percent
| NMVOC | ||||
| Lubricant-type group | Proportion range of total sales since 1990 | Default | Range | Reference |
|---|---|---|---|---|
| Compressor oils | =< 1 % | 1.5 % | 1 - 2 % | [Lit. 2 - 7] |
| Turbine oils | < 1 % | 0.5 % | 0 - 1 % | [Lit. 2, 3, 5] |
| Automotive gear oils | 5 - 10 % | 1 % | 0 - 2 % | |
| Industrial gear oils | 2 - 3 % | 1.5 % | 1 - 2 % | |
| Hydraulic oils | 6 - 15 % | 1.5 % | 1 - 2 % | |
| Machine oils | 1 - 7 % | 2.5 % | 0 - 5 % | [Lit. 2, 5, 9] |
| Other oils not for lubricating purposes | 2 - 7 % | 25 % | 0 - 50 % | [Lit. 3, 10 - 12] |
| Metalworking fluids | 5 - 9 % | 5 % | 0 - 10 % | [Lit. 2, 4, 13] |
| Base oils | 4 - 16 % | 10 % | 5 - 15 % | [Lit. 14] |
In 1995 four categories fell away/ceased to exist (Table 2) and three type groups were newly introduced due to modifications/changes in the Mineral Oil Statistics concerning lubricants. A slight adjustment of the procedure for the years 1990-1994 was needed. Table 2 shows the affected categories as well as the ways in which they were handled in the calculation procedure.
Table 2: Handling of categories in the Mineral Oil Statistics, 1990-1994
| Category | Remarks concerning the procedure | NMVOC emission factor |
|---|---|---|
| Other lubricating oils, specialty and other lubricating oils, non-specialty | These are handled like the “machine oils” group, which is lacking in the 1990-1994 period. This group includes various specialty and non-specialty libricationg oils. | 2.5 % |
| Other mineral oils for special applications | This category contains no lubricating oils. It is handled like the category “Other industrial oils not used for lubrication” which is lacking in the 1990-1994 period. | 25 % |
| Light-coloured plasticisers and extender oils | Extender oils and plasticisers are classified with the process oils. They are handled accordingly. | 0 % |
Uncertainties
For activity data, an uncertainty of 5 percent is assumed considering the well developed national statistics.
The emission factors are based on a broad review of literature and results from relevant research projects and have been discussed with senior lubricant experts. The experts suggested using ranges which are provided in the emission factor table 1.
The modifications of the Mineral Oil Statistics in 1995 show no impact of overall amount of lubricants. Only a reclassification of lubricants from unspecified application categories to specified application categories was made. The emissions for the years 1990-1994 could therefore be just up to 25% to high.
Recalculations
Recalculations of NMVOC emissions were done for the entire time series because of the integration of automotive gear oils.
For pollutant-specific information on recalculated emission estimates for Base Year and 2019, please see the recalculation tables following chapter 8.1 - Recalculations.
Planned improvements
No category-specific improvements are planned.
Bibliography
Lit. 1: Official Mineral-oil Data (amtliche Mineralöldaten) of the Federal Office of Economics and Export Control (BAFA).)
Lit. 2: Ökopol. Consultation of different senior lubricant experts and manufacturers: Hamburg, 2017.)
Lit. 3: Zimmermann, T.; Jepsen, D. Return rates for used lubricant oils in Belgium: Study on Waste Oil Return in Belgium; Ökopol, 2017.)
Lit. 4: Jepsen, D.; Zimmermann, T.; Sander, K.; Wagner, J. Erhebung der Struktur des Altölsammelmarktes und Optimierungspotenziale für bessere Altölqualitäten im Kontext der Abfallhierarchie; Hg. v. Umweltbundesamt (UBA). Ökopol: Dessau-Roßlau, 2016.)
Lit. 5: Sander, K.; Jepsen, D.; Zangl, S.; Schilling, S. Stoffstrom- und Marktanalyse zur Sicherung der Altölentsorgung. Forschungsbericht 204 31 32 UBA-FB 000883: Dessau-Roßlau, 2006.)
Lit. 6: Kline & Company. Lubricant Consumption and Used Oil Generation in California: A Segmented Market Analysis: Part II: Collectable Used Oil Availability in California, 2000-2011. published 03/03/2015: Sacramento, CA, USA, 2012.)
Lit. 7: UNEP. Compendium of Recycling and Destruction Technologies for Waste Oils: Osaka, Japan, 2012.)
Lit. 8: VSI. Getriebeöle; https://www.vsi-schmierstoffe.de/index.php.)
Lit. 9: Vidal-Abarca, G. C.; Kaps, R.; Oliver, W.; Escamilla, M.; Josa, J.; Riera, M. R.; Benedicto, E. Revision of European Ecolabel Criteria for Lubricants. Preliminary Report: Sevilla, 2016.)
Lit. 10: Möller, U. J. Altölentsorgung durch Verwertung und Beseitigung; Kontakt & Studium Bd. 253; Expert Verlag: Renningen, 2004.)
Lit. 11: Bartz, W. J.; Springer, G.; Blanke, H.-J. Expert Praxislexikon Tribologie Plus: 2010 Begriffe für Studium und Beruf, 2., völlig neubearb. Aufl. des Lexikons der Schmierungstechnik von G. Vögtle; Expert Verlag: Renningen, 2000.)
Lit. 12: VSI. Grundöle; https://www.vsi-schmierstoffe.de/index.php.)
Lit. 13: Kolshorn, K.-U.; Wiesert, P.; Götz, R.; Rippen, G. Ermittlung von Altölvermeidungspotentialen: UBA-Forschungsvorhaben Nr. 103 60 111; Trischler und Partner GmbH: Darmstadt, 1996.)
Lit. 14: UBA, 2018: Zimmermann, T.; Jepsen, D. (2018) Entwicklung von Methoden zur Berechnung von Treibhausgas- und Luftschadstoffemissionen aus der Verwendung von Schmierstoffen und Wachsen.)
Use of lubricants in mobile applications
In sub-category 2.D.3.i - Other product use: Use of lubricants in mobile applications, the German air pollutant emisisons inventory includes emissions from the unintentional co-incineration of lubricants in mobile sources.
As emissions from the use of lubricants in stationary machinery result mostly from the evaporation whereas emissions from mobile machinery result mostly from the unintentional co-incineration within the engine, the methods for emission calculation differ widely.
Therefore, the approaches for estimating emissions from these two areas of lubricant application are looked at in separate sub-chapters linked below.
Methodology
Activity data
Basically, the amounts of lubricants unintentionally co-incinerated in engines other than 2-strokes is estimated from the annual amounts of fuels used in these engines, excluding the amounts of fuels used for international aviation and navigation.
Here, the majority of lubricant co-incineration takes place in road vehicles. These related amounts of co-incinerated lubricants are calculated directly within TREMOD 1).
Table 1: Annual amounts of lubricants co-incinerated in mobile vehicles and machinery - excluding 2-stroke engines, in terajoules
| 1990 | 1995 | 2000 | 2005 | 2006 | 2007 | 2008 | 2009 | 2010 | 2011 | 2012 | 2013 | 2014 | 2015 | 2016 | 2017 | 2018 | 2019 | 2020 |
|---|---|---|---|---|---|---|---|---|---|---|---|---|---|---|---|---|---|---|
| 1,400 | 1,602 | 1,714 | 1,747 | 1,796 | 1,826 | 1,825 | 1,841 | 1,881 | 1,914 | 1,941 | 1,963 | 1,965 | 1,983 | 1,771 | 1,400 | 1,602 | 1,714 | 1,747 |
source: own estimations and TREMOD 2)
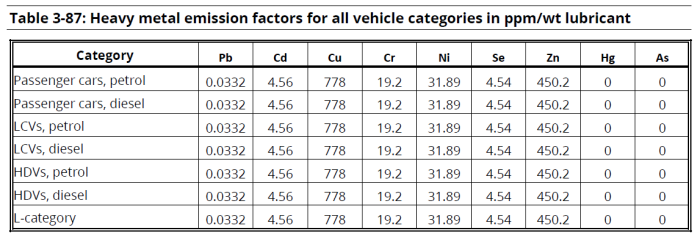
The emission factors are derived from chapter 1.A.3.b.i-iv Road transport 2019, Table 3-87 of the EMEP/EEA air pollutant emission inventory guidebook 2019 3).
These default values were transferred via a NCV of 0.03985 GJ/kg into the following energy-related values:
Table 2: tier1 emission factors for heavy-metal emissions from co-incinerated lubricants, in g/TJ
| As | Cd | Cr | Cu | Hg | Ni | Pb | Se | Zn |
|---|---|---|---|---|---|---|---|---|
| 0.00 | 114 | 482 | 19,523 | 0.00 | 800 | 0.81 | 114 | 11,297 |
Discussion of emission trends
With default emission factors applied, emissions' trends depend solely on the amounts of unintentionally co-incinerated lubricants (see Table 1).
Table 3: Annual heavy-metal emissions from co-incinerated lubricants, in metric tonnes
| 1990 | 1995 | 2000 | 2005 | 2006 | 2007 | 2008 | 2009 | 2010 | 2011 | 2012 | 2013 | 2014 | 2015 | 2016 | 2017 | 2018 | 2019 | 2020 | |
|---|---|---|---|---|---|---|---|---|---|---|---|---|---|---|---|---|---|---|---|
| As | 0.00 | 0.00 | 0.00 | 0.00 | 0.00 | 0.00 | 0.00 | 0.00 | 0.00 | 0.00 | 0.00 | 0.00 | 0.00 | 0.00 | 0.00 | 0.00 | 0.00 | 0.00 | 0.00 |
| Cd | 0.16 | 0.18 | 0.20 | 0.20 | 0.20 | 0.20 | 0.20 | 0.20 | 0.21 | 0.21 | 0.21 | 0.21 | 0.22 | 0.22 | 0.22 | 0.22 | 0.22 | 0.23 | 0.20 |
| Cr | 0.67 | 0.77 | 0.83 | 0.84 | 0.85 | 0.86 | 0.85 | 0.86 | 0.87 | 0.88 | 0.88 | 0.89 | 0.91 | 0.92 | 0.94 | 0.95 | 0.95 | 0.96 | 0.85 |
| Cu | 27.3 | 31.3 | 33.5 | 34.1 | 34.4 | 34.8 | 34.6 | 34.8 | 35.1 | 35.6 | 35.6 | 36.0 | 36.7 | 37.4 | 37.9 | 38.3 | 38.4 | 38.7 | 34.6 |
| Hg | 0.00 | 0.00 | 0.00 | 0.00 | 0.00 | 0.00 | 0.00 | 0.00 | 0.00 | 0.00 | 0.00 | 0.00 | 0.00 | 0.00 | 0.00 | 0.00 | 0.00 | 0.00 | 0.00 |
| Ni | 1.12 | 1.28 | 1.37 | 1.40 | 1.41 | 1.43 | 1.42 | 1.43 | 1.44 | 1.46 | 1.46 | 1.47 | 1.51 | 1.53 | 1.55 | 1.57 | 1.57 | 1.59 | 1.42 |
| Pb | 0.00 | 0.00 | 0.00 | 0.00 | 0.00 | 0.00 | 0.00 | 0.00 | 0.00 | 0.00 | 0.00 | 0.00 | 0.00 | 0.00 | 0.00 | 0.00 | 0.00 | 0.00 | 0.00 |
| Se | 0.16 | 0.18 | 0.20 | 0.20 | 0.20 | 0.20 | 0.20 | 0.20 | 0.20 | 0.21 | 0.21 | 0.21 | 0.21 | 0.22 | 0.22 | 0.22 | 0.22 | 0.23 | 0.20 |
| Zn | 15.8 | 18.1 | 19.4 | 19.7 | 19.9 | 20.1 | 20.0 | 20.1 | 20.3 | 20.6 | 20.6 | 20.8 | 21.2 | 21.6 | 21.9 | 22.2 | 22.2 | 22.4 | 20.0 |
Recalculations
Activity data (annual amounts of unintentionally co-incinerated lubricants) have been revised slightly for the entire time series. Here, for 2019, larger changes occur due to the finalisation of this year's National Energy Balance, whereas for 2018 the erronous over-all amount of co-incinerated lubricants has been corrected.
Table: Revised annual amounts of unintentionally co-incinerated lubricants, in terajoules
| 1990 | 1995 | 2000 | 2005 | 2006 | 2007 | 2008 | 2009 | 2010 | 2011 | 2012 | 2013 | 2014 | 2015 | 2016 | 2017 | 2018 | 2019 | |
|---|---|---|---|---|---|---|---|---|---|---|---|---|---|---|---|---|---|---|
| Submission 2022 | 1,400 | 1,602 | 1,714 | 1,747 | 1,760 | 1,781 | 1,772 | 1,782 | 1,796 | 1,826 | 1,825 | 1,841 | 1,881 | 1,914 | 1,941 | 1,963 | 1,965 | 1,983 |
| Submission 2021 | 1,415 | 1,606 | 1,710 | 1,747 | 1,755 | 1,769 | 1,762 | 1,776 | 1,791 | 1,824 | 1,822 | 1,838 | 1,877 | 1,915 | 1,956 | 1,980 | 1,759 | 1,769 |
| absolute change | -14.6 | -3.88 | 3.60 | 0.15 | 5.05 | 12.5 | 9.98 | 6.02 | 4.96 | 1.53 | 2.51 | 2.98 | 3.52 | -0.49 | -14.8 | -17.4 | 206 | 214 |
| relative change | -1.03% | -0.24% | 0.21% | 0.01% | 0.29% | 0.71% | 0.57% | 0.34% | 0.28% | 0.08% | 0.14% | 0.16% | 0.19% | -0.03% | -0.76% | -0.88% | 11.7% | 12.1% |
On the other hand, the tier1 emission factors applied so far, remain unrevised compared to last year's submission.
Therefore, the canges in the emission estimates reported for this sub-category result solely from the named revisions in activity data.
For pollutant-specific information on recalculated emission estimates for Base Year and 2019, please see the pollutant specific recalculation tables following chapter 8.1 - Recalculations.
Planned improvements
Although there are no improvements planned for this specific sub-category, several routine model revisions are scheduled for mobile sources with impact on fuel consumption data and, hence, the amounts of unintentionally co-incinerated lubricants.