meta data for this page
This is an old revision of the document!
Chapter 1.8 - General Assessment of Completeness
Introduction
The German inventory is generally complete regarding the main pollutants, TSP, particulate matter and CO. National total emissions of these pollutants are considered to be representative and reflect the current emissions situation. Nevertheless, there are some cases where no appropriate method or data is available. It’s assumed that these cases do not have a noticeable effect on the national totals and are in the range of its uncertainties.
In terms of heavy metals and POPs, the situation is different due to the low data availability. As additional information, there is a specific overview on the completeness of the German POP inventory available.
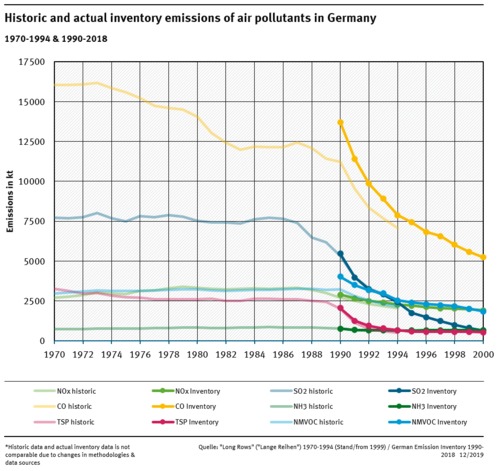
Germany does not report any emission data for years prior 1990. Due to the split into GDR and BRD before 1990, there are no consistent data sets covering what is now the reunited country. Germany has no plans to work on emission inventories for the years 1980 to 1989 in the future. However, some summarizing information on the time span 1970 to 1989 is presented below, also comparing these data to the current emission inventory.
Completeness in detail
The completeness of the German inventory as a whole has also been assessed by multiple reviews, both under the CLRTAP and the NECD. These reviews all confirm the good coverage of the German inventory. Where there are small omissions, Germany is working continuously to update and complete its data.
The following sections reflect on a few approaches, by source category, for improving the completeness of the inventory.
Fuel combustion
In principle, all combustion-related activities (1.A) are recorded in full within the National Energy Balance (NEB) of the Federal Republic of Germany. Nonetheless, where it is evident that complete coverage is not achieved for certain sub-sectors (i.e. non-commercial use of wood, waste fuels), the NEB is supplemented with further statistical data, surveys etc. Moreover, there are frequent changes within the NEB, in particular concerning renewable energies. Such changes in fuel and source categories require considerable research work. Insofar, it's not always possible to implement all data in time. However, based on current information, combustion related activity data can be considered complete.
This also applies for the main pollutants, particulate matter and CO. There may be cases, where a further breakdown of activity data and emission factors would be more appropriate to represent any specific technology. In such cases, where the share of a specific technology is very small, the influence of a missing sub-division on the national totals is considered small, too.
In some source categories, separation of combustion-related and non-combustion-related emissions from industry requires further verification. In general, for such categories, avoidance of double counting is an important part of quality assurance.
In terms of heavy metals and POPs, emissions are not yet complete in some sectors due to a lack of appropriate emission factors. Since they may not properly reflect the situation in Germany and in order to avoid inconsistencies within the German inventory as a whole, it is not always advisable to use default emission factors. In addition, fixed default EFs do not reflect the influence of technological developments onto the trends of certain emissions. Nevertheless, many country-specific emission factors (which are highly uncertain) are available for all combustion plants. All key categories are reported.
Industrial processes
In the area of industrial processes, for the application of higher tier approaches some use is made of production data from association statistics and of manufacturers' information. In the interest of the inventory's completeness and reliability those data sets get specific QA/QC procedures. The inventory is considered complete for the main industrial processes.
Agriculture
In the area of agriculture, while survey data from a past research project on management systems in animal husbandry are available, an effort is being made to carry out periodic, representative data surveys, in the interest of the inventory's continuing completeness and consistency.
Explanation on the use of notation keys
The use of notation keys in the German inventory is carefully checked each year. All notation keys are used as defined in the guidance documents. The following table from the stage 1 review gives a good indication on where and how frequently notation keys are used in the reporting:
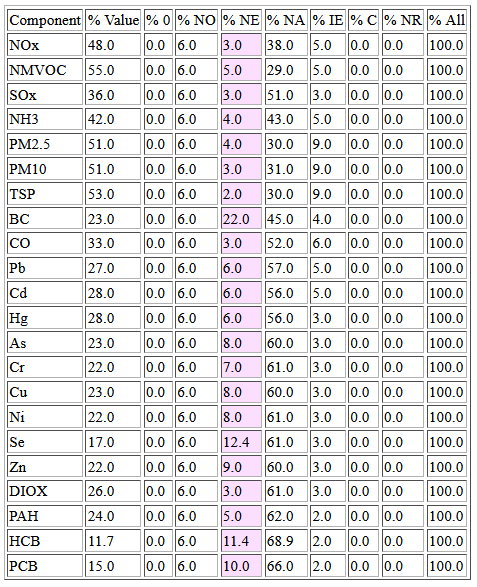
As shown in the table, most flagged cells are the ones reporting on the use of NE. Though NEs are great in number, the actual emission behind each of the notation keys is estimated to be very small. In some cases, it is actually used instead of NA to make absolutely sure to be on the conservative side of the estimate. As for categories, mainly Industrial Processes and Waste are using NEs (please refer to section 1c of the review report for details). Each use is individually justified in the corresponding source category sections of this report as well as in the table below.
Germany is working continuously to decrease the number of notation keys used and has already made good progress in this regard.
NFR categories reported as 'not estimated' ('NE')
TODO
NFR categories reported as 'included elsewhere ('IE')
| NFR category | pollutants effected | included in | explanation / reasoning |
|---|---|---|---|
| 1.A.1.a | B[b]F, B[k]F, I[1,2,3-c,d]P | PAHs 1-4 total | only summarized PAH data available |
| 1.A.1.b | B[b]F, B[k]F, I[1,2,3-c,d]P | PAHs 1-4 total | only summarized PAH data available |
| 1.A.1.c | B[b]F, B[k]F, I[1,2,3-c,d]P | PAHs 1-4 total | only summarized PAH data available |
| 1.A.2.b | PM2.5, PM10, TSP | 2.C | considered to be process emissions |
| 1.A.2.c | all emissions | 1.A.2.g viii (energy related emissions), 2.B (process related emissions) | |
| 1.A.2.d | all emissions | 1.A.2.g viii (energy related emissions), 2.H.1 (process related emissions) | |
| 1.A.2.e | PM2.5, PM10, TSP | 2.C (process related emissions) | only emissions from process-combustion systems of the sugar industry are reported. Emissions from CHP plants and steam boiler are reported under 1.A.2.g viii |
| 1.A.2.f | NOx, NMVOC, SOx, PM2.5, PM10, TSP, BC, Pb, Cd, Hg | 2.A.1-4 | |
| 1.A.2.g viii | B[b]F, B[k]F, I[1,2,3-c,d]P | PAHs 1-4 total | only summarized PAH data available |
| 1.A.3.d i(ii) | all emissions | 1.A.3.d ii | no separate AD available for international inland navigation |
| 1.A.4.a i | B[b]F, B[k]F, I[1,2,3-c,d]P | PAHs 1-4 total | only summarized PAH data available |
| 1.A.4.b i | B[b]F, B[k]F, I[1,2,3-c,d]P | PAHs 1-4 total | only summarized PAH data available |
| 1.A.4.c i | B[b]F, B[k]F, I[1,2,3-c,d]P | PAHs 1-4 total | only summarized PAH data available |
| 1.A.5.a | B[b]F, B[k]F, I[1,2,3-c,d]P | PAHs 1-4 total | only summarized PAH data available |
| 2.A.1 | CO, B[b]F, B[k]F, I[1,2,3-c,d]P | CO: 1.A.2.f; B[b]F, B[k]F, I[1,2,3-c,d]P in PAHs 1-4 total | only summarized PAH data available |
| 2.A.2 | NH3, CO | 1.A.2.f | |
| 2.A.3 | CO | 1.A.2.f | |
| 2.A.5.c | PM2.5, PM10, TSP, BC | 2.L | emissions from storage, handling and transport of mineral products are included in NFR 2.L |
| 2.A.6 | CO | 1.A.2.f | |
| 2.B.10.b | PM2.5, PM10, TSP | 2.L | emissions from storage, handling and transport of chemical products are included in NFR 2.L |
| 2.C.7.d | PM2.5, PM10, TSP | 2.L | emissions from storage, handling and transport of metal products are included in NFR 2.L |
| 2.D.3.b | CO | 1.A.2.f | |
| 3.B.4.a | NOx, NMVOC, NH3, PM2.5, PM10, TSP | 3.B.1.a, 3.B.1.b | buffaloes included in the population figures for cattle |
| 3.B.4.f | NOx, NMVOC, NH3, PM2.5, PM10, TSP | 3.B.4.e | mules and asses are included in population figures for horses |
Emission data for years before 1990
Consistent time series for emissions for years before 1990 are not available.
Up to 1994, Germany calculated emission inventories separately for both parts of Germany in separated procedures, using different substructures and data sources.
From 1995 onward, the emissions were calculated for the unified country only. All inventory improvements coming from own QA/QC or review recommendations couldn't be applied for the years before 1990. Insofar, the long-time series is provided only as additional information and to illustrate the general trend since 1970.