meta data for this page
This is an old revision of the document!
Recalculations - Non-Methane Volatile Organic Compounds
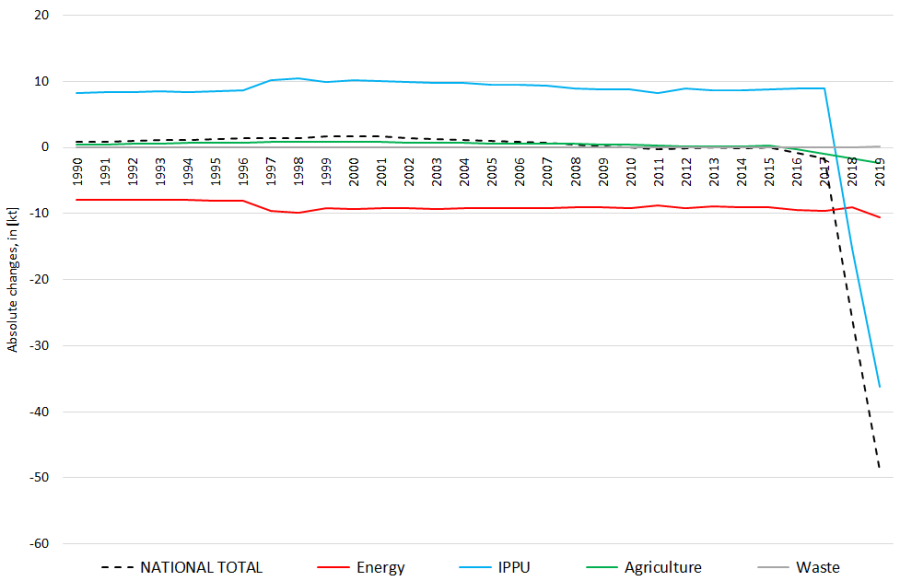
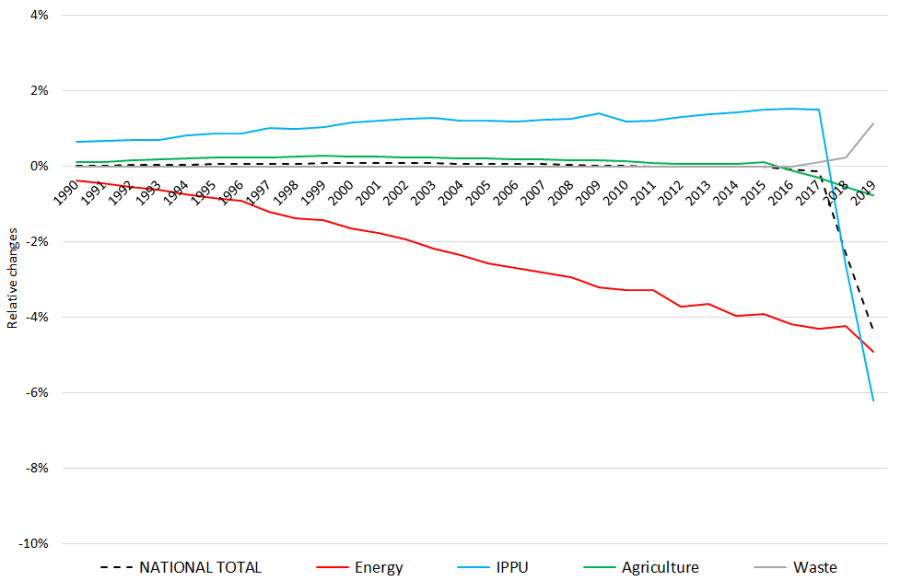
Revision of NMVOC emissions over time
The significant changes within the National Total reported for 1990 (+594 kt | +17.26 %) are dominated by icreased emission estimates from NFRs 1.A.3.b i, ii, iii and 1.A.3.b v as well as 3.B.1.a and b and newly implemented emissions in NFRs 5.A and 5.C.2.
In NFR 2 - IPPU, emissions from 2.D.3.a have been re-allocated to NFRs 2.D.3.f, h and i with no impact on the sector's total emissions.
Due to newly implemented emission estimates, the strongest relative change occurs for NFR 5 with +30,040%.Table 1: Changes in emission estimates for 1990
^ ^ ^
Changes within the National Total reported for 2018 (+96.66 kt | +9.04 %) are dominated by revisions in NFRs 3.B.1.a and b, 5.A and 5.C.2.
In addition, several changes occur throughoutNFRs 1 and 2.
Due to newly implemented emission estimates, the strongest relative change occurs for NFR 5 with +13,301%.
Table 2: Changes in emission estimates for 2018


