meta data for this page
1.A.4.a i - Commercial and Institutional: Stationary Combustion
Short description
![]()
The source category 1.A.4.a.i - Commercial and Institutional: Stationary Combustion emissions from commercial and institutional combustion installations are reported.
| Category Code | Method | AD | EF | ||||||||||||
|---|---|---|---|---|---|---|---|---|---|---|---|---|---|---|---|
| 1.A.4.a.i | T2, T3 | NS | CS, D | ||||||||||||
| NOx | NMVOC | SO2 | NH3 | PM2.5 | PM10 | TSP | BC | CO | PB | Cd | Hg | Diox | PAH | HCB | |
| Key Category: | -/- | L/T | -/- | -/- | L/T | L/T | L/T | -/- | L/T | L/- | -/- | -/- | L/- | L/- | -/- |
Methodology
Activity data
For further information on activity data please refer to the superordinte chapter on small stationary combustion.
Emission factors
For further information on the emission factors applied please refer to the superordinte chapter on small stationary combustion.
Table 1: Emission factors for commercial and institutional combustion installations
| Pollutant | NOx | SOx | CO | NMVOC | TSP | PM10 | PM2.5 | PAH | PCDD/F |
|---|---|---|---|---|---|---|---|---|---|
| Fuel | [kg/TJ] | Fuel | [kg/TJ] | ||||||
| Hard Coal | 89.8 | 331.7 | 2,162 | 30.3 | 18.5 | 17.6 | 15.7 | 19,215 | 16.3 |
| Residual Wood | 92.7 | 8.2 | 931.5 | 66.8 | 46.5 | 44.6 | 40.0 | 144,957 | 355.3 |
| Light Heating Oil | 43.7 | 3.3 | 11.9 | 2.3 | 1.0 | 1.0 | 1.0 | 20.15 | 2.7 |
| Natural Gas | 22.0 | 0.1 | 12.0 | 0.4 | 0.03 | 0.03 | 0.03 | 3.08 | 1.6 |
TSP and PM emission factors are to a large extend based on measurements without condensed compounds, according to CEN-TS 15883, annex I. PAH measurement data contain the following individual substances: Benzo(a)pyrene, Benzo(k)fluoranthene, Indeno(1,2,3-cd)pyrene, Benzo(b)fluoranthene, Benzo(j)fluoranthene, Benzo(ghi)perylene, Anthracene, Benzo(a)anthracene, Chrysene(+Trihenylene) and Dibenz(a,h)anthracene, as a specific part of US EPA.
Trend Discussion for Key Sources
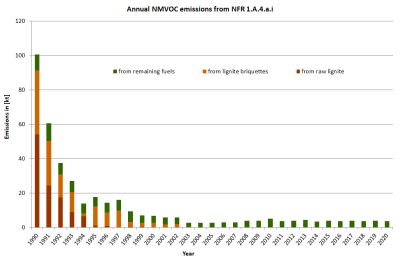
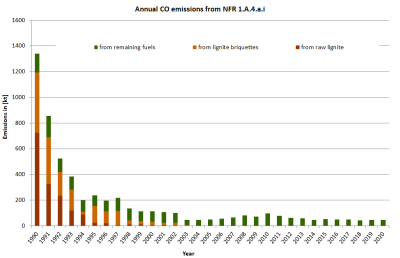
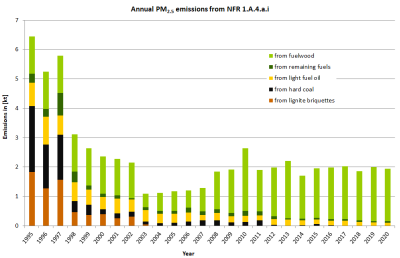
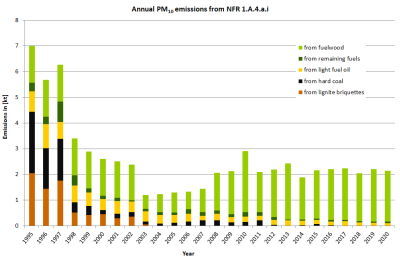
The following charts give an overview and assistance for explaining dominant emission trends of selected pollutants.
Fuel Consumption
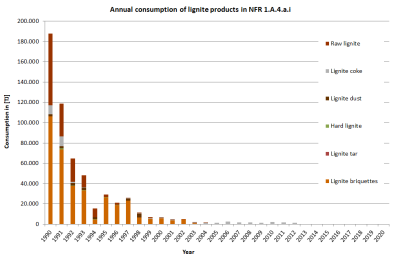
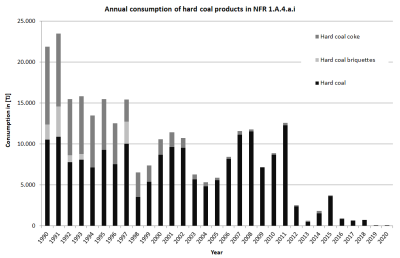
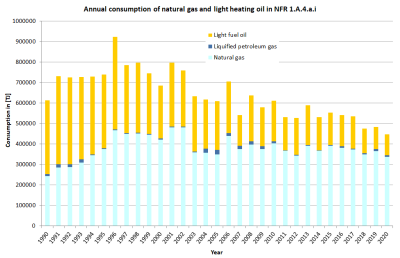
Annual fluctuations of all fuel types in source category 1.A.4 depend on heat demand subject to winter temperatures. From 1990 to the present time, fuel use changed considerably from coal & lignite to natural gas. The consumption of light heating oil decreased as well. As the activity data for light heating oil is based on the sold amount, it fluctuates due to fuel prices and changing storage amounts. The remarkable decrease of hard coal consumption in 2012 is caused by a change in statistics (data source).
Non-Methane Volatile Organic Compounds - NMVOC and Carbon monoxide - CO
Main driver of the NMVOC and CO emission trends is the decreasing lignite consumption: Since 1990 the fuel use changed from solid fuels causing high NMVOC and CO emissions to gaseous fuels producing much lower emissions.
Particulate Matter - PM2.5 & PM10 & TSP
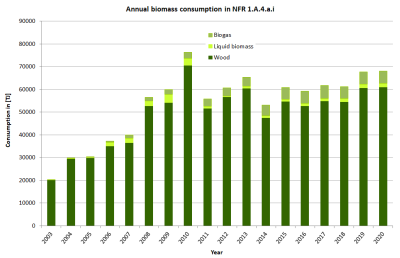
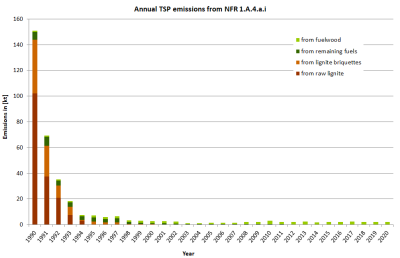
The emission trends for PM2.5, PM10, and TSP are also influenced severely by decreasing coal consumption in small combustion plants, particularly in the period from 1990 to 1994. Since 1995 the emission trend hardly changed. Increasing emissions in the last years are caused by the rising wood combustion.
Persistent Organic Pollutants
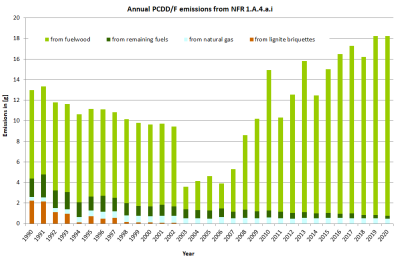
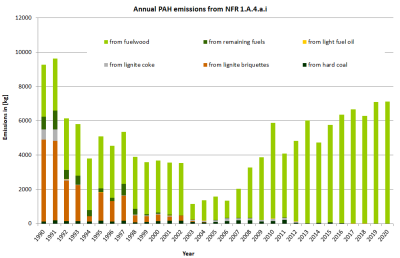
The main driver of the POPs emission trend are coal and fuel-wood. PCDD/F emissions decrease from 1990 to 2003 due to decreasing lignite consumption. The use of firewood and therefore PCDD/F emissions from wood combustion show a constant development.
Recalculations
Recalculations were necessary for 2019 due to the implementation of the now finalised National Energy Balance.
Furthermore, compared to submission 2021, PAH emissions have been recalculated for all small combustion sources due to a revision of emission factors applied.
For pollutant-specific information on recalculated emission estimates for Base Year and 2019, please see the recalculation tables following chapter 8.1 - Recalculations.
Planned improvements
There is a running Project on new emission factors for small combustion plants using updated data from chimney sweepers and new measurement data.


