meta data for this page
1.A.3.d i (i) - International maritime navigation
Short description
Under NFR category 1.A.3.d i (i), emissions from international maritime navigation fuelling in and starting form German harbours are reported.
| Category Code | Method | AD | EF | ||||||||||||
|---|---|---|---|---|---|---|---|---|---|---|---|---|---|---|---|
| 1.A.3.d i (i) | T1, T2, T3 | NS, M | CS, M | ||||||||||||
| Key Category | SO2 | NOx | NH3 | NMVOC | CO | BC | Pb | Hg | Cd | Diox | PAH | HCB | TSP | PM10 | PM2.5 |
| 1.A.3.d i (i) | not included in key category analysis | ||||||||||||||
Methodology
Activity data
Primary fuel delivery data (primary activity data, PAD) for international maritime navigation is included in line 6 - 'International Deep-Sea Bunkers' of the National Energy Balances (NEB) (AGEB, 2021) 1) together with respective data for IMO-registered ships used in national maritime transport (see 1.A.3.d ii (a)), fishing (see NFR 1.A.4.c iii) and military navigation (see NFR 1.A.5.b iii).
The AD applied for international maritime navigation therefore represents the remains of primary fuel delivery data from NEB line 6 minus the modelled consumption data estimated for non-IMO ships in 1.A.3.d ii (a), 1.A.4.c iii and 1.A.5.b iii:
| AD1.A.3.d i = PADNEB line 6 - AD1.A.3.d ii (a) - IMO - AD1.A.4.c iii - IMO - AD1.A.5.b iii - IMO | with * AD1.A.3.d i - tier1 activity data for International maritime navigation * PADNEB line 6 - primary over-all fuel deliveries data from NEB line 6 - 'International Maritime Bunkers' * AD1.A.3.d ii (a) - IMO - tier3 activity data for IMO-registered ships involved in national maritime navigation * AD1.A.4.c iii - IMO - tier3 activity data for IMO-registered ships involved in national fishing * AD1.A.5.b iii - IMO - tier3 activity data for IMO-registered ships involved in military navigation |
As a result, activity data can fluctuate strongly from year to year.
However, this effect can be explained with the fact that large ocean-going ships do not need to bunker fuels on every single harbour but can go on for weeks without any additional fuel uptake.
This can be further increased with increasing differences in fuel prices.
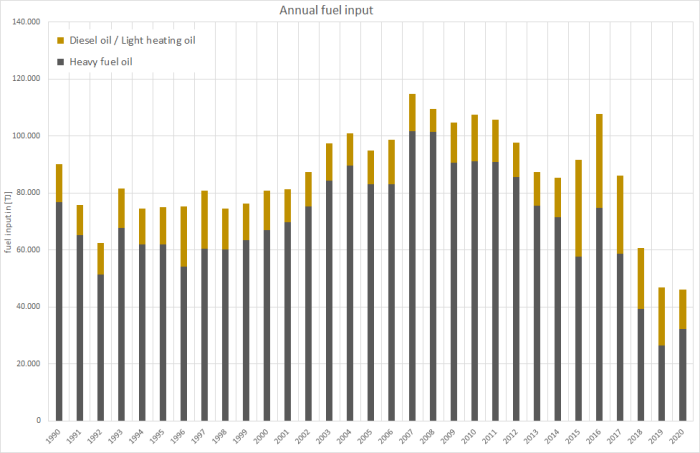
Table 1: Annual fuel consumption, in terajoules
| 1990 | 1995 | 2000 | 2005 | 2006 | 2007 | 2008 | 2009 | 2010 | 2011 | 2012 | 2013 | 2014 | 2015 | 2016 | 2017 | 2018 | 2019 | 2020 | |
|---|---|---|---|---|---|---|---|---|---|---|---|---|---|---|---|---|---|---|---|
| Diesel Oil | 13,162 | 13,096 | 13,709 | 11,820 | 15,629 | 12,954 | 8,075 | 14,095 | 16,417 | 15,020 | 12,181 | 11,875 | 13,801 | 33,958 | 32,832 | 27,463 | 21,473 | 20,231 | 13,896 |
| Heavy fuel oil | 76,942 | 62,066 | 67,080 | 83,224 | 83,164 | 101,820 | 101,466 | 90,542 | 91,169 | 90,779 | 85,586 | 75,559 | 71,598 | 57,792 | 74,807 | 58,707 | 39,308 | 26,565 | 32,253 |
| Ʃ 1.A.3.d i | 90,104 | 75,162 | 80,789 | 95,044 | 98,793 | 114,774 | 109,542 | 104,637 | 107,586 | 105,799 | 97,768 | 87,434 | 85,398 | 91,750 | 107,639 | 86,169 | 60,781 | 46,796 | 46,150 |
source: own estimates based on underlying BSH model (Deichnik, K. (2021)) 2)
Consumption of heavy oil has been increasing since 1984 as a result of high petroleum prices, global increases in transports and increasing maritime use of diesel engines that can run on heavy oil. The emissions fluctuations that occurred in the navigation sector in 1992 and 1996 were caused by trade and oil crises.
Furthermore, after 2014, with ever stricter legislation espacially regarding fuel sulphur content, an ongoing shift from heavy fuel oil to maritime diesel oil can be observed.
Emission factors
For main pollutants and particulate matter, modelled emission factors are available from (Deichnik, K. (2021)).
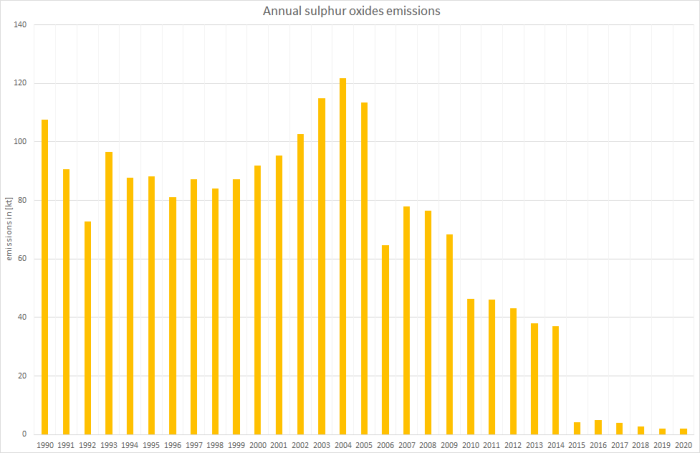
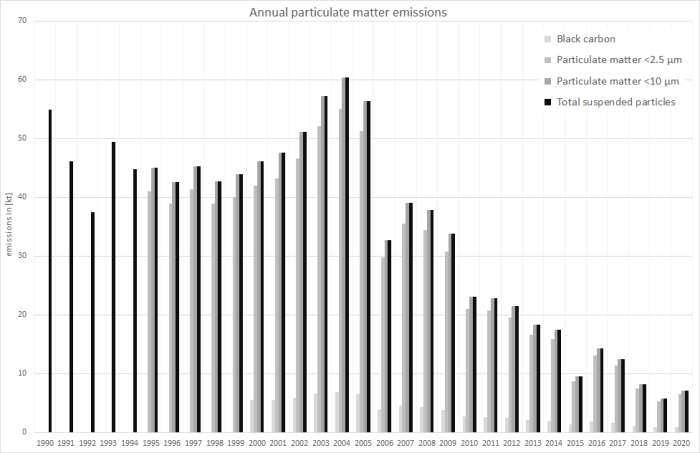
Here, for sulphur dioxide and particulate matter, annual values are available representing the impact of fuel sulphur legislation. In addition, regarding SO2, the increasing operation of so-called scrubbers in order to fullfil emission limits especially within SECA areas is reflected for heavy fuel oil.
Table 2: Annual country-specific emission factors, in kg/TJ
| 1990 | 1995 | 2000 | 2005 | 2006 | 2007 | 2008 | 2009 | 2010 | 2011 | 2012 | 2013 | 2014 | 2015 | 2016 | 2017 | 2018 | 2019 | 2020 | |
|---|---|---|---|---|---|---|---|---|---|---|---|---|---|---|---|---|---|---|---|
| DIESEL OIL | |||||||||||||||||||
| NH3 | 0.32 | 0.32 | 0.32 | 0.32 | 0.32 | 0.32 | 0.32 | 0.32 | 0.32 | 0.32 | 0.32 | 0.32 | 0.32 | 0.32 | 0.32 | 0.32 | 0.32 | 0.32 | 0.32 |
| NMVOC | 48.5 | 48.4 | 48.4 | 48.4 | 48.4 | 48.4 | 48.4 | 48.4 | 48.4 | 48.4 | 48.4 | 47.7 | 44.9 | 44.4 | 43.9 | 44.2 | 43.8 | 44.0 | 44.0 |
| NOx | 1,101 | 1,101 | 1,101 | 1,101 | 1,101 | 1,101 | 1,101 | 1,101 | 1,101 | 1,101 | 1,119 | 1,126 | 1,155 | 1,184 | 1,183 | 1,189 | 1,200 | 1,199 | 1,169 |
| SOx | 466 | 419 | 233 | 186 | 186 | 186 | 140 | 69.8 | 69.8 | 65.2 | 54.8 | 52.9 | 51.1 | 37.2 | 37.2 | 37.2 | 37.2 | 37.2 | 37.2 |
| BC1 | 110 | 99.1 | 55.0 | 44.0 | 44.1 | 44.1 | 33.0 | 16.5 | 16.5 | 15.5 | 15.4 | 15.3 | 15.3 | 17.4 | 17.7 | 17.7 | 17.3 | 17.5 | 16.8 |
| PM2.5 | 354 | 320 | 177 | 142 | 142 | 142 | 106 | 53,3 | 53,3 | 49,9 | 49,8 | 49,3 | 49,4 | 56,2 | 57,1 | 57,1 | 55,9 | 56,5 | 54,2 |
| PM10 | 378 | 342 | 190 | 152 | 152 | 152 | 114 | 57,1 | 57,1 | 53,4 | 53,3 | 52,7 | 52,9 | 60,1 | 61,1 | 61,1 | 59,8 | 60,4 | 58,0 |
| TSP2 | 378 | 342 | 190 | 152 | 152 | 152 | 114 | 57,1 | 57,1 | 53,4 | 53,3 | 52,7 | 52,9 | 60,1 | 61,1 | 61,1 | 59,8 | 60,4 | 58,0 |
| CO | 128 | 128 | 128 | 128 | 128 | 128 | 128 | 128 | 128 | 129 | 128 | 128 | 130 | 140 | 142 | 141 | 139 | 140 | 138 |
| HEAVY FUEL OIL | |||||||||||||||||||
| NH3 | 0.33 | 0.33 | 0.33 | 0.33 | 0.33 | 0.33 | 0.33 | 0.33 | 0.33 | 0.33 | 0.33 | 0.33 | 0.34 | 0.34 | 0.34 | 0.34 | 0.34 | 0.34 | 0.34 |
| NMVOC | 43.0 | 42.8 | 42.9 | 42.9 | 42.8 | 42.8 | 42.9 | 42.8 | 42.8 | 42.7 | 42.8 | 41.6 | 42.3 | 26.1 | 30.2 | 33.7 | 32.5 | 32.7 | 37.4 |
| NOx | 1,368 | 1,368 | 1,368 | 1,368 | 1,368 | 1,368 | 1,368 | 1,367 | 1,368 | 1,367 | 1,367 | 1,384 | 1,433 | 1,487 | 1,440 | 1,479 | 1,480 | 1,507 | 1,509 |
| SOx | 1,319 | 1,332 | 1,323 | 1,336 | 744 | 742 | 742 | 744 | 496 | 496 | 496 | 495 | 506 | 48.6 | 49.2 | 48.1 | 45.9 | 46.5 | 48.1 |
| BC1 | 70.8 | 71.2 | 70.8 | 71.6 | 39.8 | 39.7 | 39.7 | 39.7 | 26.5 | 26.5 | 26.5 | 25.6 | 25.6 | 14.2 | 18.0 | 20.1 | 19.1 | 18.9 | 21.4 |
| PM2.5 | 590 | 594 | 590 | 596 | 331 | 331 | 331 | 331 | 221 | 221 | 221 | 213 | 213 | 118 | 150 | 168 | 159 | 158 | 179 |
| PM10 | 649 | 653 | 649 | 656 | 365 | 364 | 364 | 364 | 243 | 243 | 243 | 234 | 235 | 130 | 165 | 184 | 175 | 173 | 197 |
| TSP2 | 649 | 653 | 649 | 656 | 365 | 364 | 364 | 364 | 243 | 243 | 243 | 234 | 235 | 130 | 165 | 184 | 175 | 173 | 197 |
| CO | 179 | 179 | 179 | 179 | 179 | 179 | 179 | 179 | 179 | 179 | 179 | 175 | 173 | 144 | 162 | 157 | 156 | 150 | 151 |
1 estimated from f-BCs as provided in 3): f-BC (HFO) = 0.12, f-BC (MDO/MGO) = 0.31 as provided in 4), chapter: 1.A.3.d.i, 1.A.3.d.ii, 1.A.4.c.iii Navigation, Tables 3-1 & 3-2
2 ratios PM2.5 : PM10 : TSP derived from the tier1 default EF as provided in 5), chapter: 1.A.3.d.i, 1.A.3.d.ii, 1.A.4.c.iii Navigation, Tables 3-1 & 3-2
For the country-specific emission factors applied for particulate matter, no clear indication is available, whether or not condensables are included.
For information on the emission factors for heavy-metal and POP exhaust emissions, please refer to Appendix 2.3 - Heavy Metal (HM) exhaust emissions from mobile sources and Appendix 2.4 - Persistent Organic Pollutant (POP) exhaust emissions from mobile sources.
Discussion of emission trends
NFR 1.A.3.d i is not considered in the key category analysis.
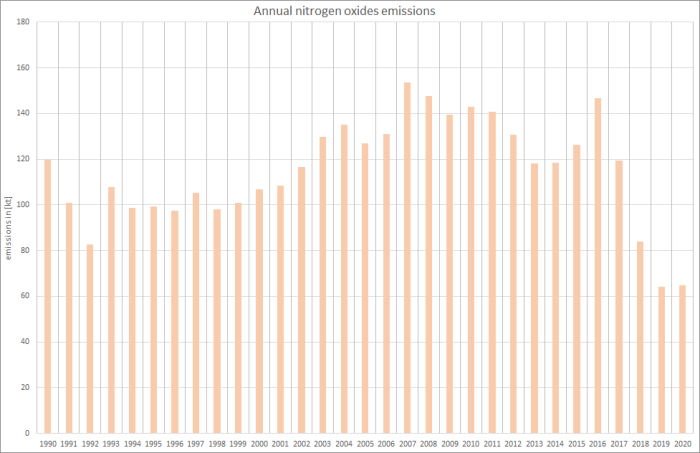
Basically, with no significant technical improvements with respect to mitigation technologies, trends in emissions depend more or less directly the amounts of fuels bunkered in German harbours and the contributions of diesel oil/light heating oil and heavy fuel oil to the over-all fuel input.
Here, as the amounts of fuels allocated to international maritime navigation represent the remains of annual over-all inland fuel deliveries minus fuel consumption in domestic shipping, activity data and, hence, emissions, fluctuate strongly from year to year (see also information on activity data as stated above).
Therefore, especially emission trends for unregulated pollutants (such as NH3, NOx, NMVOC and CO, all HM and POPs) with only slight changes in the annual over-all IEFs applied, follow the trends in fuel consumption and the shares of diesel and heavy fuel oil:
In contrast, emission trends for SOx and PM, both depending on the fuel's sulphur content, follow not only the trends in fuel consumption but do also reflect fuel-sulphur legislation:
Recalculations
Resulting from changes in the fuel consumption data computed within 6) for domestic maritime navigation, the activity data for international maritime navigation have been revised for the entire timeseries.
Table 3: Revised annual fuel consumption data, in terajoules
| 1990 | 1995 | 2000 | 2005 | 2006 | 2007 | 2008 | 2009 | 2010 | 2011 | 2012 | 2013 | 2014 | 2015 | 2016 | 2017 | 2018 | 2019 | |
|---|---|---|---|---|---|---|---|---|---|---|---|---|---|---|---|---|---|---|
| DIESEL OIL | ||||||||||||||||||
| current submission | 13,162 | 13,096 | 13,709 | 11,820 | 15,629 | 12,954 | 8,075 | 14,095 | 16,417 | 15,020 | 12,181 | 11,875 | 13,801 | 33,958 | 32,832 | 27,463 | 21,473 | 20,231 |
| previous submission | 12,748 | 12,919 | 13,664 | 11,993 | 15,817 | 17,524 | 13,105 | 14,412 | 16,662 | 15,370 | 12,594 | 12,414 | 13,674 | 33,088 | 28,093 | 22,924 | 15,213 | 18,327 |
| absolute change | 413 | 176 | 44.9 | -173 | -188 | -4,570 | -5,030 | -317 | -246 | -350 | -412 | -539 | 126 | 870 | 4,738 | 4,538 | 6,260 | 1,904 |
| relative change | 3.24% | 1.36% | 0.33% | -1.44% | -1.19% | -26.1% | -38.4% | -2.20% | -1.48% | -2.28% | -3.27% | -4.35% | 0.92% | 2.63% | 16.9% | 19.8% | 41.1% | 10.4% |
| HEAVY FUEL OIL | ||||||||||||||||||
| current submission | 76,942 | 62,066 | 67,080 | 83,224 | 83,164 | 101,820 | 101,466 | 90,542 | 91,169 | 90,779 | 85,586 | 75,559 | 71,598 | 57,792 | 74,807 | 58,707 | 39,308 | 26,565 |
| previous submission | 68,484 | 56,323 | 60,984 | 78,182 | 78,257 | 96,625 | 96,017 | 85,865 | 86,934 | 86,687 | 81,171 | 71,364 | 67,670 | 57,850 | 74,837 | 58,781 | 39,380 | 26,601 |
| absolute change | 8,458 | 5,743 | 6,096 | 5,042 | 4,907 | 5,195 | 5,449 | 4,678 | 4,236 | 4,092 | 4,415 | 4,195 | 3,928 | -57.9 | -30.0 | -74.1 | -71.7 | -35.9 |
| relative change | 12.4% | 10.2% | 10.0% | 6.45% | 6.27% | 5.38% | 5.68% | 5.45% | 4.87% | 4.72% | 5.44% | 5.88% | 5.80% | -0.10% | -0.04% | -0.13% | -0.18% | -0.14% |
| OVER-ALL FUEL CONSUMPTION | ||||||||||||||||||
| current submission | 90,239 | 75,275 | 80,910 | 95,187 | 98,941 | 114,946 | 109,706 | 104,794 | 107,747 | 105,958 | 97,914 | 87,565 | 85,527 | 91,888 | 107,800 | 86,299 | 60,872 | 46,866 |
| previous submission | 81,354 | 69,346 | 74,760 | 90,310 | 94,215 | 114,320 | 109,286 | 100,428 | 103,751 | 102,210 | 93,905 | 83,904 | 81,466 | 91,075 | 103,085 | 81,828 | 54,674 | 44,995 |
| absolute change | 8,885 | 5,929 | 6,150 | 4,877 | 4,726 | 626 | 420 | 4,367 | 3,996 | 3,748 | 4,009 | 3,661 | 4,060 | 813 | 4,715 | 4,471 | 6,197 | 1,871 |
| relative change | 10.9% | 8.55% | 8.23% | 5.40% | 5.02% | 0.55% | 0.38% | 4.35% | 3.85% | 3.67% | 4.27% | 4.36% | 4.98% | 0.89% | 4.57% | 5.46% | 11.3% | 4.16% |
1 as provided in AGEB(2021) 7), line 6: “Hochseebunkerungen”: including light heating oil
In addition, all country-specific emission factors have been revised compared to last year's submission but cannot be displayed here.
For pollutant-specific information on recalculated emission estimates for Base Year and 2019, please see the recalculation tables following chapter 8.1 - Recalculations.
Uncertainties
Uncertainty estimates for activity data of mobile sources derive from research project FKZ 360 16 023: “Ermittlung der Unsicherheiten der mit den Modellen TREMOD und TREMOD-MM berechneten Luftschadstoffemissionen des landgebundenen Verkehrs in Deutschland” by Knörr et al. (2009) 8).
Planned improvements
Besides routine maintenance and further development of the BSH model, no improvements are planned.


