meta data for this page
1.A.3.d ii - National Navigation
Short description
Under category 1.A.3.d ii - National Navigation emissions from national navigation (both inland and maritime) are reported.
| Category Code | Method | AD | EF | ||||||||||||
|---|---|---|---|---|---|---|---|---|---|---|---|---|---|---|---|
| 1.A.3.d ii | T1, T2, T3 | NS, M | CS, D, M | ||||||||||||
| NOx | NMVOC | SO2 | NH3 | PM2.5 | PM10 | TSP | BC | CO | PB | Cd | Hg | Diox | PAH | HCB | |
| Key Category: | L/- | -/- | -/- | -/- | L/T | -/T | -/- | -/- | -/- | -/- | -/- | -/- | -/- | -/- | -/- |
Methodology
Activity data
As described for the over-all sector 1.A.3.d and all other navigational activities in the superordinate chapter, specific fuel consumption data for NFR 1.A.3.d ii is included in the primary fuel deliveries data provided in NEB lines 6 ('International Maritime Bunkers') and 64 ('Coastal and Inland Navigation') 1).
Here, the annual fuel consumption for domestic maritime navigation are modelled within 2) based on AIS data and deduced from NEB lines 6 and 64 respectively, depending on whether or not a certain ship is registered by the International Maritime Organization (IMO). Here, fuels consumed by large, IMO-registered and sea-going ships and vessels are included in NEB line 6 whereas fuels consumed by smaller ships without IMO-registration are included in NEB line 64. After these deductions, the amounts of fuels remaining in NEB 64 are allocated to domestic inland navigation.
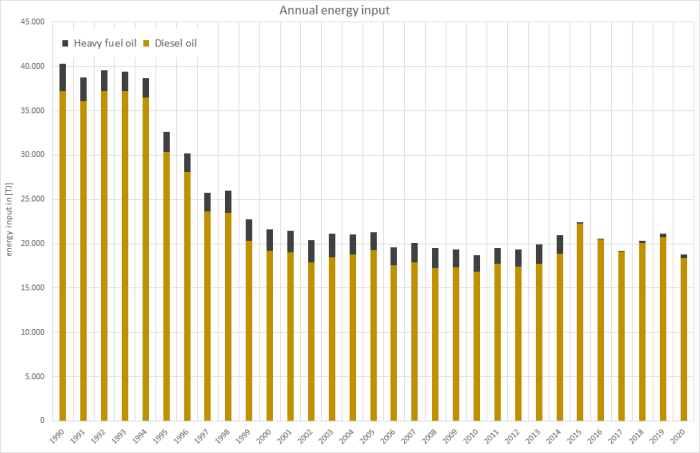
Table 1: Annual over-all fuel consumption for domestic navigation, in terajoule
| 1990 | 1995 | 2000 | 2005 | 2006 | 2007 | 2008 | 2009 | 2010 | 2011 | 2012 | 2013 | 2014 | 2015 | 2016 | 2017 | 2018 | 2019 | 2020 | |
|---|---|---|---|---|---|---|---|---|---|---|---|---|---|---|---|---|---|---|---|
| Diesel Oil | 37,199 | 30,389 | 19,231 | 19,250 | 17,553 | 17,930 | 17,268 | 17,365 | 16,872 | 17,719 | 17,411 | 17,768 | 18,878 | 22,301 | 20,466 | 19,110 | 20,064 | 20,756 | 18,417 |
| Heavy fuel oil | 3,103 | 2,186 | 2,382 | 2,054 | 2,025 | 2,160 | 2,278 | 1,988 | 1,810 | 1,790 | 1,932 | 2,134 | 2,057 | 108 | 37.0 | 81.1 | 262 | 394 | 368 |
| Ʃ 1.A.3.d ii | 40,303 | 32,575 | 21,613 | 21,304 | 19,579 | 20,090 | 19,546 | 19,353 | 18,682 | 19,509 | 19,343 | 19,902 | 20,935 | 22,409 | 20,503 | 19,191 | 20,326 | 21,150 | 21,150 |
Table 2: Specific fuel consumption data for domestic maritime and inland navigation, in terajoule
| 1990 | 1995 | 2000 | 2005 | 2006 | 2007 | 2008 | 2009 | 2010 | 2011 | 2012 | 2013 | 2014 | 2015 | 2016 | 2017 | 2018 | 2019 | 2020 | |
|---|---|---|---|---|---|---|---|---|---|---|---|---|---|---|---|---|---|---|---|
| NATIONAL MARITIME NAVIGATION | |||||||||||||||||||
| Diesel Oil | 9,484 | 6,828 | 7,367 | 6,399 | 6,360 | 6,763 | 7,101 | 6,254 | 5,690 | 5,669 | 6,089 | 6,133 | 6,766 | 8,980 | 9,335 | 8,960 | 9,445 | 9,497 | 8,339 |
| Heavy fuel oil | 3,103 | 2,186 | 2,382 | 2,054 | 2,025 | 2,160 | 2,278 | 1,988 | 1,810 | 1,790 | 1,932 | 2,134 | 2,057 | 108,0 | 37,0 | 81,1 | 262 | 394 | 368 |
| NATIONAL INLAND NAVIGATION | |||||||||||||||||||
| Diesel Oil | 27,716 | 23,562 | 11,864 | 12,851 | 11,193 | 11,167 | 10,167 | 11,111 | 11,182 | 12,050 | 11,322 | 11,635 | 12,112 | 13,321 | 11,131 | 10,150 | 10,619 | 11,259 | 10,078 |
| Ʃ 1.A.3.d ii | 40,303 | 32,575 | 21,613 | 21,304 | 19,579 | 20,090 | 19,546 | 19,353 | 18,682 | 19,509 | 19,343 | 19,902 | 20,935 | 22,409 | 20,503 | 19,191 | 20,326 | 21,150 | 18,785 |
Emission factors
The emission factors applied for national maritime navigation are derived from different sources and therefore are of very different quality.
For the main pollutants, country-specific implied values are used, that are based on tier3 EF included in the BSH model 3) which mainly relate on values from the EMEP/EEA guidebook 2019 4). These modelled IEFs take into account the ship specific information derived from AIS data as well as the mix of fuel-qualities applied depending on the type of ship and the current state of activity.
Here, for sulphur dioxide and particulate matter, annual values are available representing the impact of fuel sulphur legislation. In addition, regarding 2, the increasing operation of so-called scrubbers in order to fullfil emission limits especially within SECA areas is reflected for heavy fuel oil.
Table 3: Country-specific emission factors applied for fuels used in domestic maritime navigation, in [kg/TJ]
| 1990 | 1995 | 2000 | 2005 | 2006 | 2007 | 2008 | 2009 | 2010 | 2011 | 2012 | 2013 | 2014 | 2015 | 2016 | 2017 | 2018 | 2019 | 2020 | |
|---|---|---|---|---|---|---|---|---|---|---|---|---|---|---|---|---|---|---|---|
| DIESEL OIL | |||||||||||||||||||
| NH3 | 0,32 | 0,32 | 0,32 | 0,32 | 0,32 | 0,32 | 0,32 | 0,32 | 0,32 | 0,32 | 0,32 | 0,32 | 0,32 | 0,32 | 0,32 | 0,32 | 0,32 | 0,32 | 0,32 |
| NMVOC | 48,5 | 48,4 | 48,4 | 48,4 | 48,4 | 48,4 | 48,4 | 48,4 | 48,4 | 48,4 | 48,4 | 47,7 | 44,9 | 44,4 | 43,9 | 44,2 | 43,8 | 44,0 | 44,0 |
| NOx | 1.101 | 1.101 | 1.101 | 1.101 | 1.101 | 1.101 | 1.101 | 1.101 | 1.101 | 1.101 | 1.119 | 1.126 | 1.155 | 1.184 | 1.183 | 1.189 | 1.200 | 1.199 | 1.169 |
| SO2 | 466 | 419 | 233 | 186 | 186 | 186 | 140 | 69,8 | 69,8 | 65,2 | 54,8 | 52,9 | 51,1 | 37,2 | 37,2 | 37,2 | 37,2 | 37,2 | 37,2 |
| BC1 | 110 | 99,1 | 55,0 | 44,0 | 44,1 | 44,1 | 33,0 | 16,5 | 16,5 | 15,5 | 15,4 | 15,3 | 15,3 | 17,4 | 17,7 | 17,7 | 17,3 | 17,5 | 16,8 |
| PM2.5 | 354 | 320 | 177 | 142 | 142 | 142 | 106 | 53,3 | 53,3 | 49,9 | 49,8 | 49,3 | 49,4 | 56,2 | 57,1 | 57,1 | 55,9 | 56,5 | 54,2 |
| PM10 | 378 | 342 | 190 | 152 | 152 | 152 | 114 | 57,1 | 57,1 | 53,4 | 53,3 | 52,7 | 52,9 | 60,1 | 61,1 | 61,1 | 59,8 | 60,4 | 58,0 |
| TSP2 | 378 | 342 | 190 | 152 | 152 | 152 | 114 | 57,1 | 57,1 | 53,4 | 53,3 | 52,7 | 52,9 | 60,1 | 61,1 | 61,1 | 59,8 | 60,4 | 58,0 |
| CO | 128 | 128 | 128 | 128 | 128 | 128 | 128 | 128 | 128 | 129 | 128 | 128 | 130 | 140 | 142 | 141 | 139 | 140 | 138 |
| HEAVY FUEL OIL | |||||||||||||||||||
| NH3 | 0,33 | 0,33 | 0,33 | 0,33 | 0,33 | 0,33 | 0,33 | 0,33 | 0,33 | 0,33 | 0,33 | 0,33 | 0,34 | 0,34 | 0,34 | 0,34 | 0,34 | 0,34 | 0,34 |
| NMVOC | 43,0 | 42,8 | 42,9 | 42,9 | 42,8 | 42,8 | 42,9 | 42,8 | 42,8 | 42,7 | 42,8 | 41,6 | 42,3 | 26,1 | 30,2 | 33,7 | 32,5 | 32,7 | 37,4 |
| NOx | 1.368 | 1.368 | 1.368 | 1.368 | 1.368 | 1.368 | 1.368 | 1.367 | 1.368 | 1.367 | 1.367 | 1.384 | 1.433 | 1.487 | 1.440 | 1.479 | 1.480 | 1.507 | 1.509 |
| SOx | 1.319 | 1.332 | 1.323 | 1.336 | 744 | 742 | 742 | 744 | 496 | 496 | 496 | 495 | 506 | 48,6 | 49,2 | 48,1 | 45,9 | 46,5 | 48,1 |
| BC1 | 70,8 | 71,2 | 70,8 | 71,6 | 39,8 | 39,7 | 39,7 | 39,7 | 26,5 | 26,5 | 26,5 | 25,6 | 25,6 | 14,2 | 18,0 | 20,1 | 19,1 | 18,9 | 21,4 |
| PM2.5 | 590 | 594 | 590 | 596 | 331 | 331 | 331 | 331 | 221 | 221 | 221 | 213 | 213 | 118 | 150 | 168 | 159 | 158 | 179 |
| PM10 | 649 | 653 | 649 | 656 | 365 | 364 | 364 | 364 | 243 | 243 | 243 | 234 | 235 | 130 | 165 | 184 | 175 | 173 | 197 |
| TSP2 | 649 | 653 | 649 | 656 | 365 | 364 | 364 | 364 | 243 | 243 | 243 | 234 | 235 | 130 | 165 | 184 | 175 | 173 | 197 |
| CO | 179 | 179 | 179 | 179 | 179 | 179 | 179 | 179 | 179 | 179 | 179 | 175 | 173 | 144 | 162 | 157 | 156 | 150 | 151 |
1 estimated from f-BCs as provided in 5): f-BC (HFO) = 0.12, f-BC (MDO/MGO) = 0.31 as provided in 6), chapter: 1.A.3.d.i, 1.A.3.d.ii, 1.A.4.c.iii Navigation, Tables 3-1 & 3-2
2 ratio of PM2.5 : PM10 : TSP derived from the tier1 default EF as provided in 7), chapter: 1.A.3.d.i, 1.A.3.d.ii, 1.A.4.c.iii Navigation, Tables 3-1 & 3-2
For the country-specific emission factors applied for particulate matter, no clear indication is available, whether or not condensables are included.
For main pollutants and particulate matter from national inland navigation, modelled emission factors are available from TREMOD (Knörr et al. (2021a)) 8). Here, for SO2, and PM, annual values reflect the impact of fuel-sulphur legislation.
Table 4: Country-specific emission factors for diesel fuels used in domestic inland navigation, in [kg/TJ]
| 1990 | 1995 | 2000 | 2005 | 2006 | 2007 | 2008 | 2009 | 2010 | 2011 | 2012 | 2013 | 2014 | 2015 | 2016 | 2017 | 2018 | 2019 | 2020 | |
|---|---|---|---|---|---|---|---|---|---|---|---|---|---|---|---|---|---|---|---|
| NH3 | 0.23 | 0.23 | 0.23 | 0.23 | 0.23 | 0.23 | 0.23 | 0.23 | 0.23 | 0.23 | 0.23 | 0.23 | 0.23 | 0.23 | 0.23 | 0.23 | 0.23 | 0.23 | 0.23 |
| NMVOC | 96.4 | 87.9 | 77.7 | 72.3 | 71.1 | 70.0 | 68.9 | 67.8 | 67.1 | 66.0 | 64.7 | 63.7 | 62.7 | 61.5 | 60.6 | 59.7 | 58.7 | 58.0 | 57.1 |
| NOx | 1,327 | 1,331 | 1,336 | 1,289 | 1,278 | 1,267 | 1,256 | 1,244 | 1,234 | 1,225 | 1,212 | 1,201 | 1,190 | 1,177 | 1,166 | 1,154 | 1,143 | 1,134 | 1,123 |
| SOx | 85.2 | 60.5 | 60.5 | 60.5 | 60.5 | 60.5 | 60.5 | 60.5 | 60.5 | 0.37 | 0.37 | 0.37 | 0.37 | 0.37 | 0.37 | 0.37 | 0.37 | 0.37 | 0.37 |
| BC1 | 17.5 | 16.0 | 14.1 | 11.8 | 11.3 | 10.8 | 10.3 | 9.72 | 9.29 | 9.09 | 8.84 | 8.63 | 8.45 | 8.24 | 8.08 | 7.91 | 7.74 | 7.62 | 7.47 |
| PM2 | 56.5 | 51.7 | 45.6 | 38.1 | 36.5 | 34.8 | 33.1 | 31.4 | 30.0 | 29.3 | 28.5 | 27.8 | 27.3 | 26.6 | 26.1 | 25.5 | 25.0 | 24.6 | 24.1 |
| CO | 417 | 387 | 337 | 299 | 290 | 282 | 274 | 265 | 259 | 254 | 248 | 242 | 237 | 232 | 227 | 223 | 218 | 215 | 210 |
1 calculated from f-BC as provided in 9), Chapter: 1.A.3.d.i, 1.A.3.d.ii, 1.A.4.c.iii, Table 3-2: f-BC (MDO/MGO) = 0.31
2 EF(PM2.5) also applied for PM10 and TSP (assumption: > 99% of TSP from diesel oil combustion consists of PM2.5)
With respect to the emission factors applied for particulate matter, given the circumstances during test-bench measurements, condensables are most likely included at least partly. 1)
For information on the emission factors for heavy-metal and POP exhaust emissions, please refer to Appendix 2.3 - Heavy Metal (HM) exhaust emissions from mobile sources and Appendix 2.4 - Persistent Organic Pollutant (POP) exhaust emissions from mobile sources.
Discussion of emission trends
Table 5: Outcome of Key Category Analysis
| for: | PM10 | PM2.5 |
|---|---|---|
| by: | L/T | L/T |
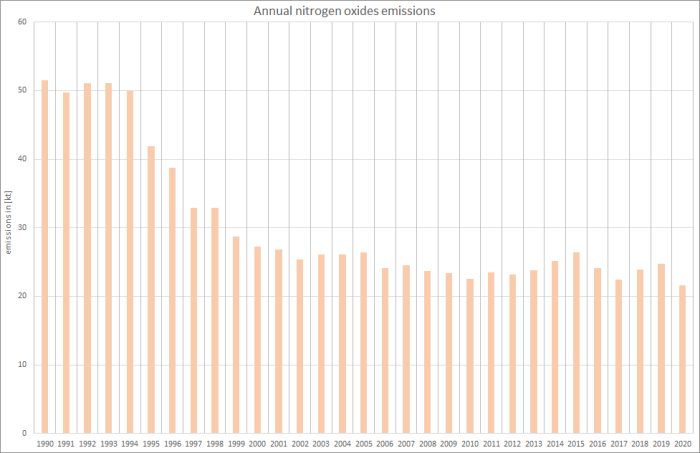
For ammonia, NMVOC, and nitrogen oxides as well as carbon monoxide, emission trends more or less represent the trend in over-all fuel consumption.
Nonetheless, for these pollutants, annual emission factors from BSH 10) and TREMOD 11) have been applied for national maritime and inland navigation, respectively, reflecting the technical development of the German inland navigation fleet.
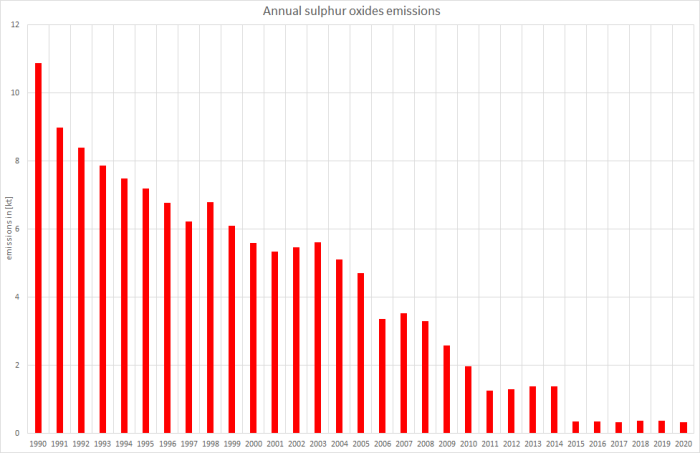
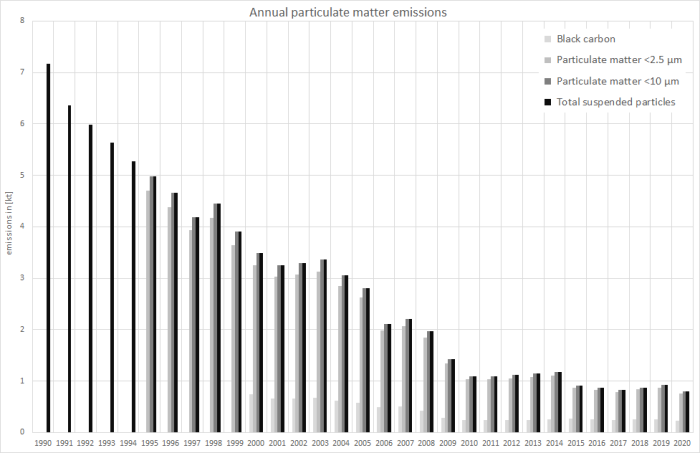
Here, the trends in sulphur dioxide and particulate matter emissions reflect the impact of ongoing fuel-sulphur legislation especially in maritime navigation.
Recalculations
Major changes in activity data result from the revision of the National Energy Balance 2019. Furthermore, as no biodiesel is blended to marine diesel oil for technical reasons, no more biodiesel is reported for nautical activities. This correction results in additional recalculations for all years as of 2004.
Table 6: Revised fuel consumption data for national maritime navigation, in terajoules
| 1990 | 1995 | 2000 | 2005 | 2006 | 2007 | 2008 | 2009 | 2010 | 2011 | 2012 | 2013 | 2014 | 2015 | 2016 | 2017 | 2018 | 2019 | |
|---|---|---|---|---|---|---|---|---|---|---|---|---|---|---|---|---|---|---|
| DIESEL OIL | ||||||||||||||||||
| current submission | 9.484 | 6.828 | 7.367 | 6.399 | 6.360 | 6.763 | 7.101 | 6.254 | 5.690 | 5.669 | 6.089 | 6.133 | 6.766 | 8.980 | 9.335 | 8.960 | 9.445 | 9.497 |
| previous submission | 15.940 | 11.258 | 11.860 | 9.962 | 9.845 | 10.395 | 10.834 | 9.486 | 8.685 | 8.489 | 9.046 | 9.047 | 9.965 | 13.359 | 16.295 | 15.221 | 16.336 | 13.961 |
| absolute change | -6.456 | -4.430 | -4.492 | -3.563 | -3.484 | -3.632 | -3.733 | -3.232 | -2.996 | -2.820 | -2.957 | -2.913 | -3.199 | -4.379 | -6.960 | -6.261 | -6.891 | -4.464 |
| relative change | -40,5% | -39,4% | -37,9% | -35,8% | -35,4% | -34,9% | -34,5% | -34,1% | -34,5% | -33,2% | -32,7% | -32,2% | -32,1% | -32,8% | -42,7% | -41,1% | -42,2% | -32,0% |
| HEAVY FUEL OIL | ||||||||||||||||||
| current submission | 3.103 | 2.186 | 2.382 | 2.054 | 2.025 | 2.160 | 2.278 | 1.988 | 1.810 | 1.790 | 1.932 | 2.134 | 2.057 | 108 | 37,0 | 81,1 | 262 | 394 |
| previous submission | 11.723 | 8.041 | 8.577 | 7.172 | 7.004 | 7.425 | 7.797 | 6.733 | 6.114 | 5.961 | 6.410 | 6.376 | 6.046 | 50,0 | 7,05 | 7,01 | 190 | 358 |
| absolute change | -8.619 | -5.855 | -6.195 | -5.118 | -4.979 | -5.265 | -5.519 | -4.745 | -4.304 | -4.171 | -4.478 | -4.242 | -3.989 | 57,9 | 30,0 | 74,1 | 71,7 | 35,9 |
| relative change | -73,5% | -72,8% | -72,2% | -71,4% | -71,1% | -70,9% | -70,8% | -70,5% | -70,4% | -70,0% | -69,9% | -66,5% | -66,0% | 116% | 425% | 1057% | 37,7% | 10,0% |
Table 7: Revised fuel consumption data for national inland navigation, in terajoules
| 1990 | 1995 | 2000 | 2005 | 2006 | 2007 | 2008 | 2009 | 2010 | 2011 | 2012 | 2013 | 2014 | 2015 | 2016 | 2017 | 2018 | 2019 | |
|---|---|---|---|---|---|---|---|---|---|---|---|---|---|---|---|---|---|---|
| current submission | 27.716 | 23.562 | 11.864 | 12.851 | 11.193 | 11.167 | 10.167 | 11.111 | 11.182 | 12.050 | 11.322 | 11.635 | 12.112 | 13.321 | 11.131 | 10.150 | 10.619 | 11.259 |
| previous submission | 20.664 | 18.597 | 6.788 | 8.634 | 7.050 | 6.836 | 5.683 | 7.129 | 7.497 | 8.466 | 7.556 | 7.777 | 8.567 | 9.422 | 7.873 | 7.179 | 7.511 | 7.595 |
| absolute change | 7.052 | 4.965 | 5.076 | 4.217 | 4.143 | 4.330 | 4.484 | 3.981 | 3.685 | 3.584 | 3.766 | 3.858 | 3.545 | 3.899 | 3.258 | 2.971 | 3.108 | 3.664 |
| relative change | 34,1% | 26,7% | 74,8% | 48,8% | 58,8% | 63,3% | 78,9% | 55,8% | 49,1% | 42,3% | 49,8% | 49,6% | 41,4% | 41,4% | 41,4% | 41,4% | 41,4% | 48,2% |
Furthermore, most of the country-specific emission factors applied for both national maritime navigation and domestic inland navigation have been revised within the BSH model and TREMOD, respectively.
For pollutant-specific information on recalculated emission estimates for Base Year and 2019, please see the recalculation tables following chapter 8.1 - Recalculations.
Uncertainties
Uncertainty estimates for activity data of mobile sources derive from research project FKZ 360 16 023: “Ermittlung der Unsicherheiten der mit den Modellen TREMOD und TREMOD-MM berechneten Luftschadstoffemissionen des landgebundenen Verkehrs in Deutschland” by Knörr et al. (2009) 12).
Planned improvements
Besides the routine revisions of the models used for maritime and inland navigation, no specific improvements are scheduled.


