meta data for this page
Recalculations - Nitrogen Oxides
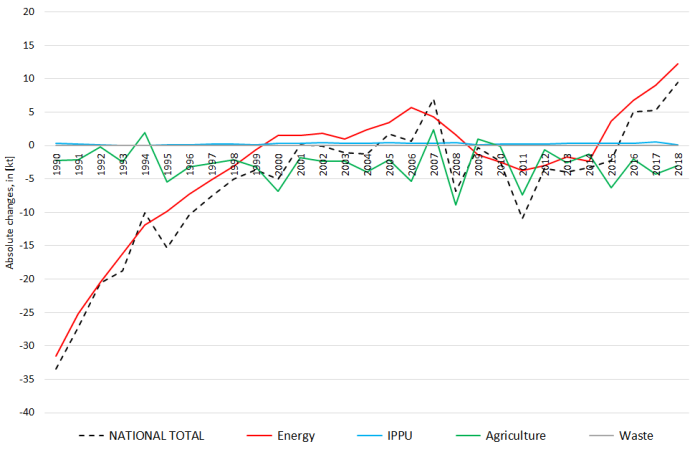
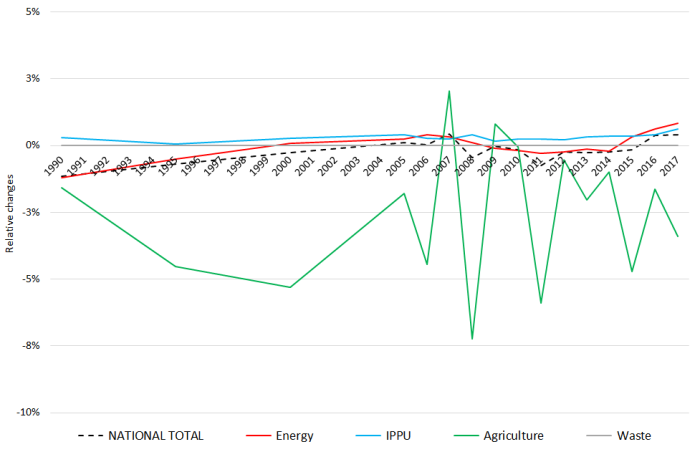
Revision of NOx emissions over time:
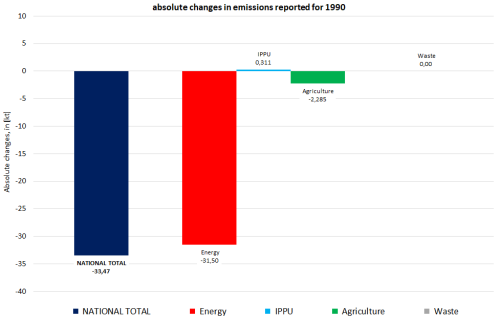
Changes within the National Total reported for 1990 (-34 kt | -1.19 %) are dominated by changes in NFRs 1.A.3.b i, 1.A.3.b ii and 1.A.3.b iii together with less significant revisions throughout NFRs 1, 2 and 3.
The most significant relative change occurs for NFR 2.G with minus 58 %.
Table 1: Changes of emission estimates 1990
 | Submission 2020 | Submission 2021 | Difference | Reasoning | |
|---|---|---|---|---|---|
| NFR Code | [kt] | relative | see description and reasoning in: | ||
| NATIONAL TOTAL | 2.884,38 | 2.850,05 | -34,33 | -1,19% | sub-category chapters |
| NFR 1 - Energy | 2.634,24 | 2.601,88 | -32,36 | -1,23% | sub-category chapters |
| 1.A.2.g vii | 49,60 | 50,23 | 0,63 | 1,28% | here |
| 1.A.3.a i(i) | 3,88 | 3,94 | 0,06 | 1,54% | here |
| 1.A.3.a ii(i) | 2,85 | 2,80 | -0,05 | -1,90% | here |
| 1.A.3.b i | 808,22 | 765,68 | -42,54 | -5,26% | here |
| 1.A.3.b ii | 41,49 | 31,49 | -10,00 | -24,11% | here |
| 1.A.3.b iii | 485,89 | 506,00 | 20,11 | 4,14% | here |
| 1.A.3.b iv | 2,61 | 2,45 | -0,16 | -6,18% | here |
| 1.A.4.a ii | 11,52 | 11,60 | 0,08 | 0,67% | here |
| 1.A.4.b ii | 0,07 | 0,06 | -0,01 | -8,44% | here |
| 1.A.4.c ii | 49,78 | 49,31 | -0,475 | -0,95% | here |
| NFR 2 - IPPU | 106,06 | 106,37 | 0,31 | 0,29% | sub-category chapters |
| 2.C.3 | NA | 0,74 | 0,74 | here | |
| 2.G | 0,74 | 0,31 | -0,43 | -58,05% | here |
| NFR 3 - Agriculture | 143,55 | 141,27 | -2,28 | -1,59% | sub-category chapters |
| 3.B.1.a | 0,72 | 0,67 | -0,05 | -7,07% | here |
| 3.B.1.b | 0,79 | 0,70 | -0,09 | -11,65% | here |
| 3.B.4.g iii | 0,00337 | 0,00339 | 0,00002 | 0,48% | here |
| 3.D.a.1 | 85,31 | 86,57 | 1,256 | 1,47% | here |
| 3.D.a.2.a | 46,65 | 43,46 | -3,19 | -6,84% | here |
| 3.D.a.3 | 8,65 | 8,44 | -0,21 | -2,42% | here |
| NFR 5 - Waste | 0,53 | 0,53 | 0,00 | 0,00% | |
| NFR 6 - Other | NA | ||||
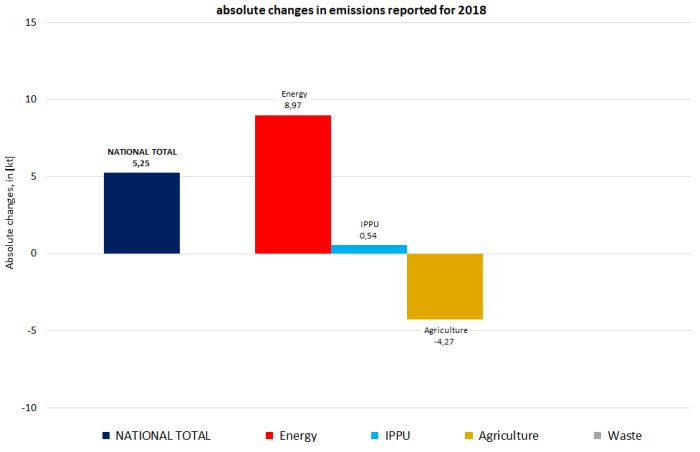
The small changes within the National Total reported for 2018 (+8.22 kt | +0.68 %) are dominated by changes in NFRs 1 and 3. Here, the most significant relative change occurs for NFR 2.G with minus 49 %.
Table 2: Changes of emission estimates 2018
 | Submission 2020 | Submission 2021 | Difference | Reasoning | |
|---|---|---|---|---|---|
| NFR Code | [kt] | relative | see description and reasoning in: | ||
| NATIONAL TOTAL | 1.202,28 | 1.210,50 | 8,22 | 0,68% | sub-category chapters |
| NFR 1 - Energy | 996,11 | 1.007,16 | 11,05 | 1,11% | sub-category chapters |
| 1.A.1.a | 239,65 | 241,73 | 2,08 | 0,87% | here |
| 1.A.1.b | 13,03 | 16,16 | 3,13 | 24,04% | here |
| 1.A.1.c | 12,04 | 13,06 | 1,02 | 8,50% | here |
| 1.A.2.a | 4,10 | 4,17 | 0,07 | 1,75% | here |
| 1.A.2.b | 0,99 | 1,02 | 0,03 | 2,54% | here |
| 1.A.2.e | 0,19 | 0,21 | 0,02 | 9,42% | here |
| 1.A.2.g vii | 11,31 | 15,37 | 4,07 | 35,97% | here |
| 1.A.2.g viii | 72,70 | 68,70 | -4,00 | -5,50% | here |
| 1.A.3.a i(i) | 11,77 | 11,84 | 0,07 | 0,61% | here |
| 1.A.3.a ii(i) | 2,31 | 2,67 | 0,35 | 15,27% | here |
| 1.A.3.b i | 286,10 | 294,97 | 8,87 | 3,10% | here |
| 1.A.3.b ii | 60,49 | 60,37 | -0,12 | -0,20% | here |
| 1.A.3.b iii | 119,39 | 116,30 | -3,09 | -2,59% | here |
| 1.A.3.b iv | 1,63 | 1,66 | 0,03 | 1,59% | here |
| 1.A.3.c | 8,71 | 7,49 | -1,23 | -14,07% | here |
| 1.A.3.d ii | 26,09 | 27,28 | 1,20 | 4,60% | here |
| 1.A.3.e i | 1,50 | 1,50 | 0,01 | 0,45% | here |
| 1.A.4.a i | 20,12 | 18,60 | -1,52 | -7,54% | here |
| 1.A.4.a ii | 9,92 | 8,15 | -1,77 | -17,86% | here |
| 1.A.4.b i | 52,65 | 54,48 | 1,83 | 3,49% | here |
| 1.A.4.b ii | 0,499 | 0,501 | 0,002 | 0,32% | here |
| 1.A.4.c i | 6,07 | 5,84 | -0,23 | -3,80% | here |
| 1.A.4.c ii | 27,29 | 27,43 | 0,14 | 0,51% | here |
| 1.A.4.c iii | 2,69 | 2,77 | 0,08 | 2,70% | here |
| 1.A.5.a | 0,25 | 0,25 | 0,00 | 0,22% | here |
| 1.A.5.b | 2,87 | 2,87 | 0,00 | 0,07% | here |
| 1.B.1.b | 0,64 | 0,65 | 0,01 | 1,55% | here |
| NFR 2 - IPPU | 86,70 | 86,82 | 0,12 | 0,14% | sub-category chapters |
| 2.A.3 | 11,71 | 11,51 | -0,20 | -1,67% | here |
| 2.C.3 | NA | 0,53 | 0,53 | here | |
| 2.G | 0,436 | 0,222 | -0,214 | -49,14% | here |
| NFR 3 - Agriculture | 118,64 | 115,69 | -2,95 | -2,49% | sub-category chapters |
| 3.B.1.a | 0,520 | 0,488 | -0,032 | -6,21% | here |
| 3.B.1.b | 0,566 | 0,497 | -0,070 | -12,31% | here |
| 3.B.3 | 0,3340 | 0,3352 | 0,0013 | 0,38% | here |
| 3.B.4.g i | 0,0180 | 0,0178 | -0,0001 | -0,65% | here |
| 3.B.4.g ii | 0,0180 | 0,0180 | 0,0000 | -0,20% | here |
| 3.B.4.g iii | 0,0108 | 0,0108 | -0,0001 | -0,67% | here |
| 3.B.4.g iv | 0,0020 | 0,0020 | 0,0000 | -0,72% | here |
| 3.D.a.1 | 59,01 | 59,11 | 0,10 | 0,17% | here |
| 3.D.a.2.a | 39,94 | 37,80 | -2,14 | -5,35% | here |
| 3.D.a.2.b | 0,56 | 0,51 | -0,05 | -8,55% | here |
| 3.D.a.2.c | 11,77 | 11,55 | -0,22 | -1,91% | here |
| 3.D.a.3 | 5,66 | 5,13 | -0,54 | -9,47% | here |
| 3.I | 0,177 | 0,172 | -0,005 | -2,68% | here |
| NFR 5 - Waste | 0,830 | 0,830 | 0,000 | 0,00% | |
| NFR 6 - Other | NA | ||||


